
Waste
The Waste tab ranks the items you are losing most to spoilage, spills, and prep. It is built from the waste you have logged — both ingredient waste and finished menu items thrown away — so it is only as complete as those entries.
The cards and the trend chart
The tab opens on up to three cards and a chart of waste over time, with the item ranking underneath. These answer how much, while the ranking answers which item — and the two read from different sources, which is why they do not always agree. The cards and the chart read your waste expense entries; the ranking reads the stock movements on each item.
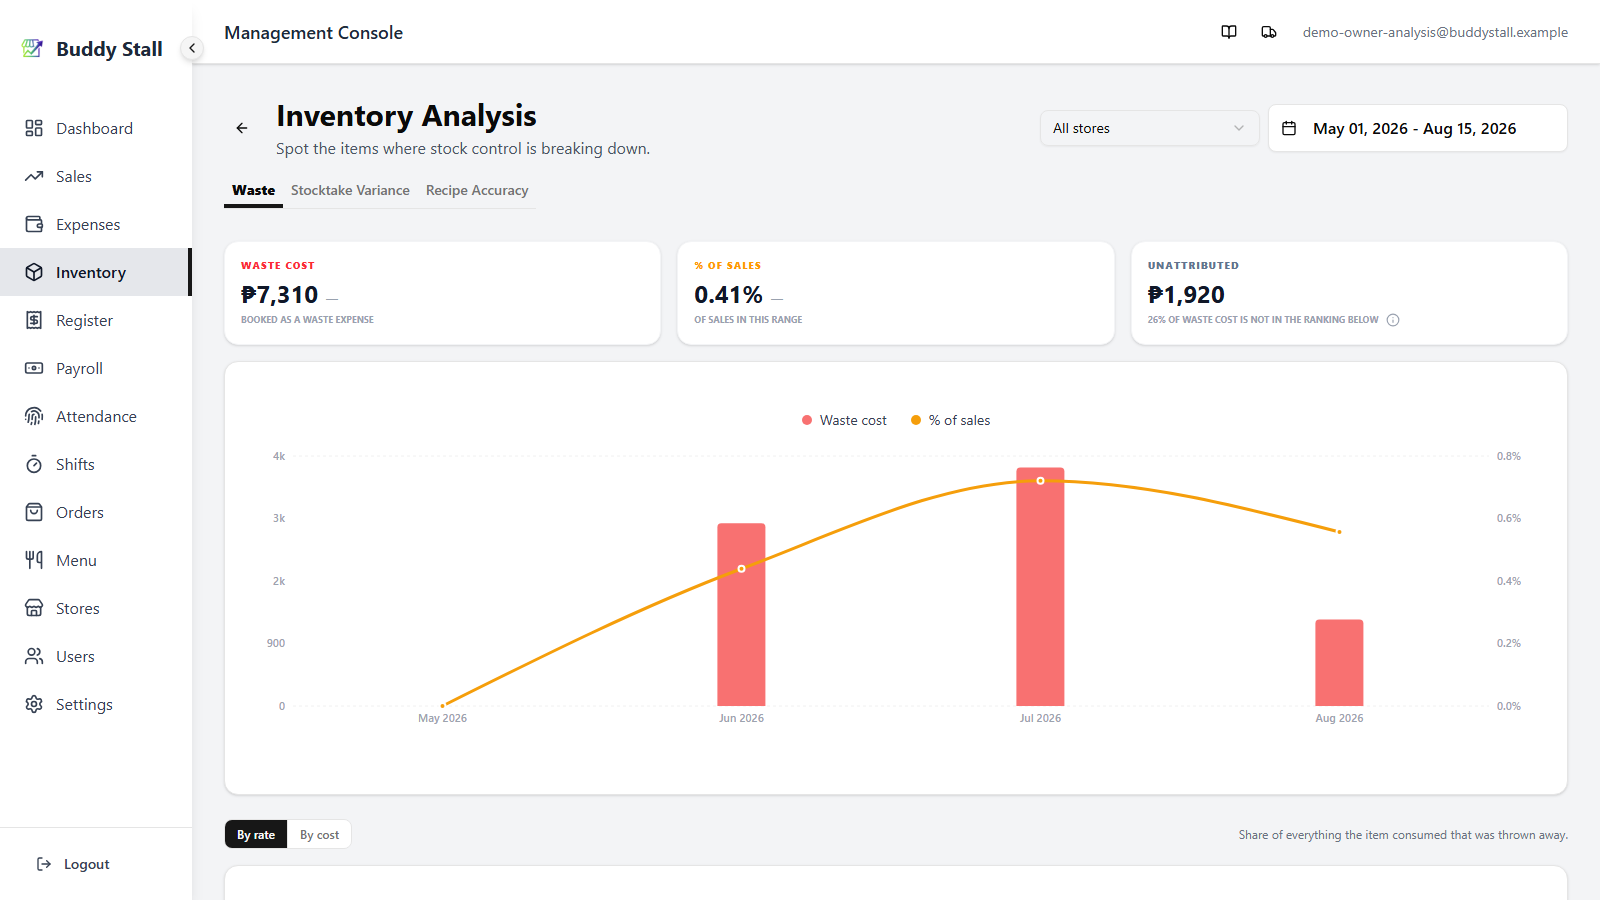 1234
12341 Waste Cost — waste booked as an expense in the period, compared against the previous period of equal length.
2 % of Sales — that cost measured against sales in the same period. It is hidden from managers who do not have sales-data permission.
3 Unattributed — the gap between the two sources. It appears only when the two do not match, so no card means the expense entries and the ranking agree.
4 The chart — booked waste as bars against the % of sales line, bucketed daily for ranges up to about a month and monthly beyond that.
Reading the Unattributed card
This card is not flagging a problem. The two figures are built from different records, so a gap between them is ordinary — Unattributed only states how big that gap is and which way it runs. Knowing what the number means is enough; its sign is the part worth reading.
Positive — waste was expensed that never reduced any item's stock. The usual cause is a wasted menu item whose recipe uses an ingredient the store does not track: the loss is priced from the whole recipe, but only registered ingredients are deducted.
Negative — the ranking adds up to more than the expense entries. That usually means a unit cost has risen since the waste happened (the ranking prices at today's cost, the entry kept its own).
The ranking
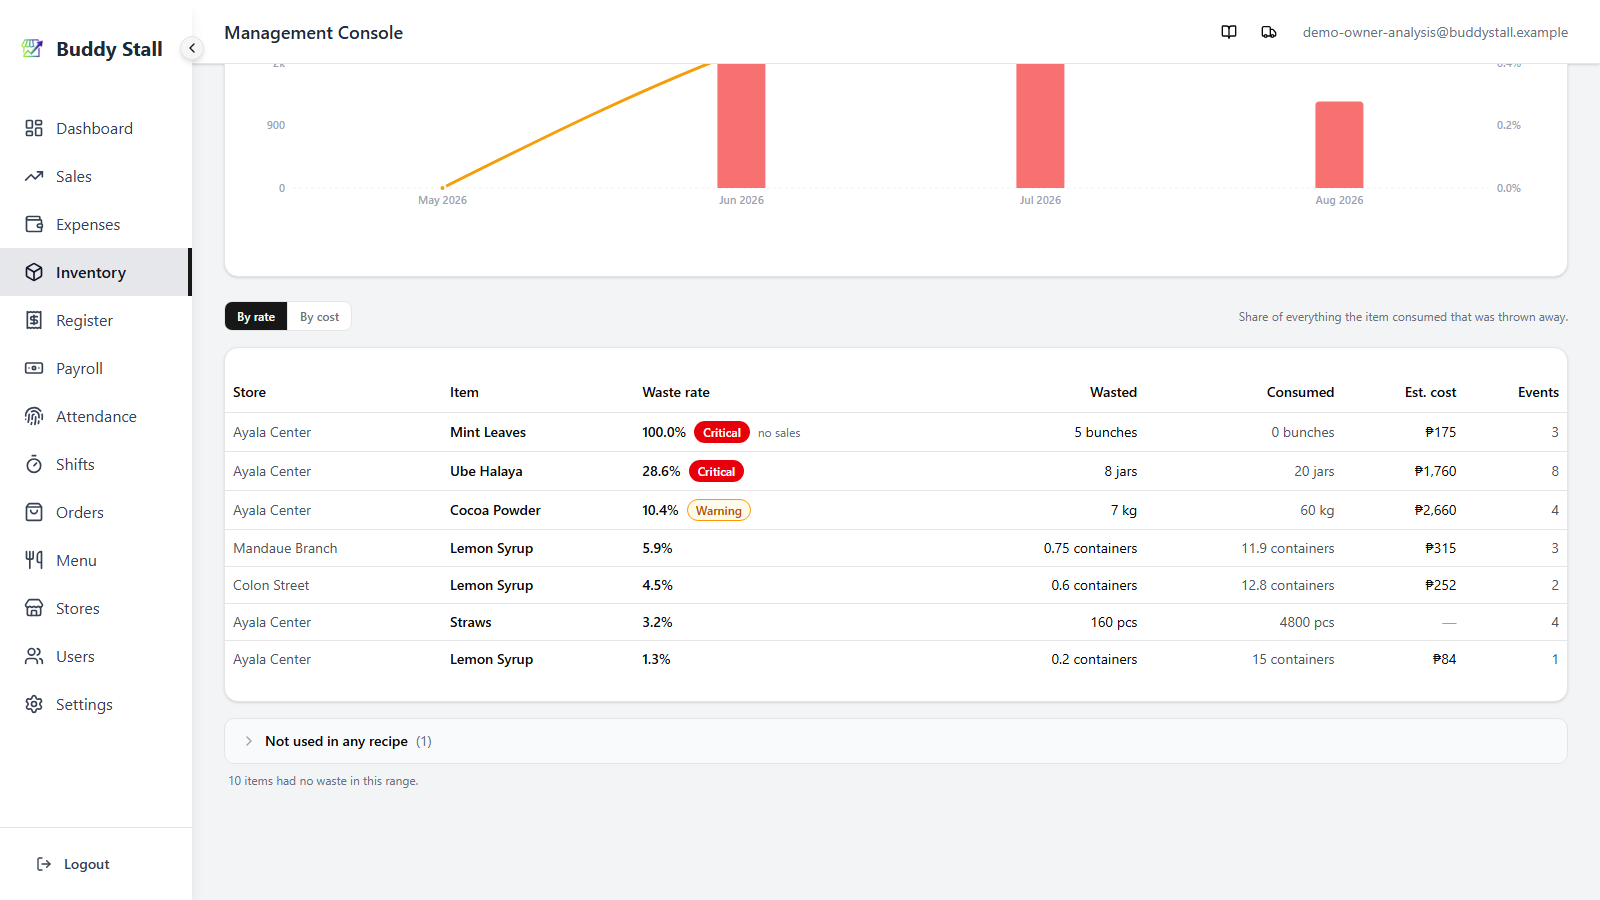
Below the chart, the ranking lists one row per item, per store. The toggle above the table switches what the ranking is ordered by and which items it can rank, but every row shows the same figures either way — you never lose sight of the money while reading the rate, or the other way round.
 123456
1 By rate / By cost — the ranking axis. By rate asks which items lose the biggest share of themselves; By cost asks where the money is going.
2 Waste rate — the share of everything the item consumed
that was thrown away, with its severity badge beside it. It reads Warning
from 10% and Critical from 25%. Food-service loss tends to run somewhere
around 4–10% overall, so treat those as starting points rather than laws: a
delicate fresh item may sit above them normally, and a packaged one should sit
far below. A qualifier can follow the figure — no sales, or no recipe for an
item nothing consumes.
3 Wasted — the quantity thrown away in the period, in the item's own unit.
4 Consumed — what left through sales and refunds. This is the rest of the rate's denominator: wasted ÷ (wasted + consumed).
5 Est. cost — the wasted quantity priced at the item's
current cost per unit. It reads — where no unit cost is set.
6 Events — how many separate waste entries make up the total, and worth a glance: 30 kg lost in one entry is a different story from 30 kg lost across 25 entries. The first points at an incident, the second at a routine.
When nothing sold in the period but waste was recorded, every unit that moved
was thrown away — the rate is exactly 100%, the true maximum of this measure.
The tab writes no sales next to it so the figure is not misread as "sold ten,
wasted ten more". These rows always sort to the top; that is intended. An item that barely sold
but was heavily wasted is an anomaly in its own right, not noise to damp down.
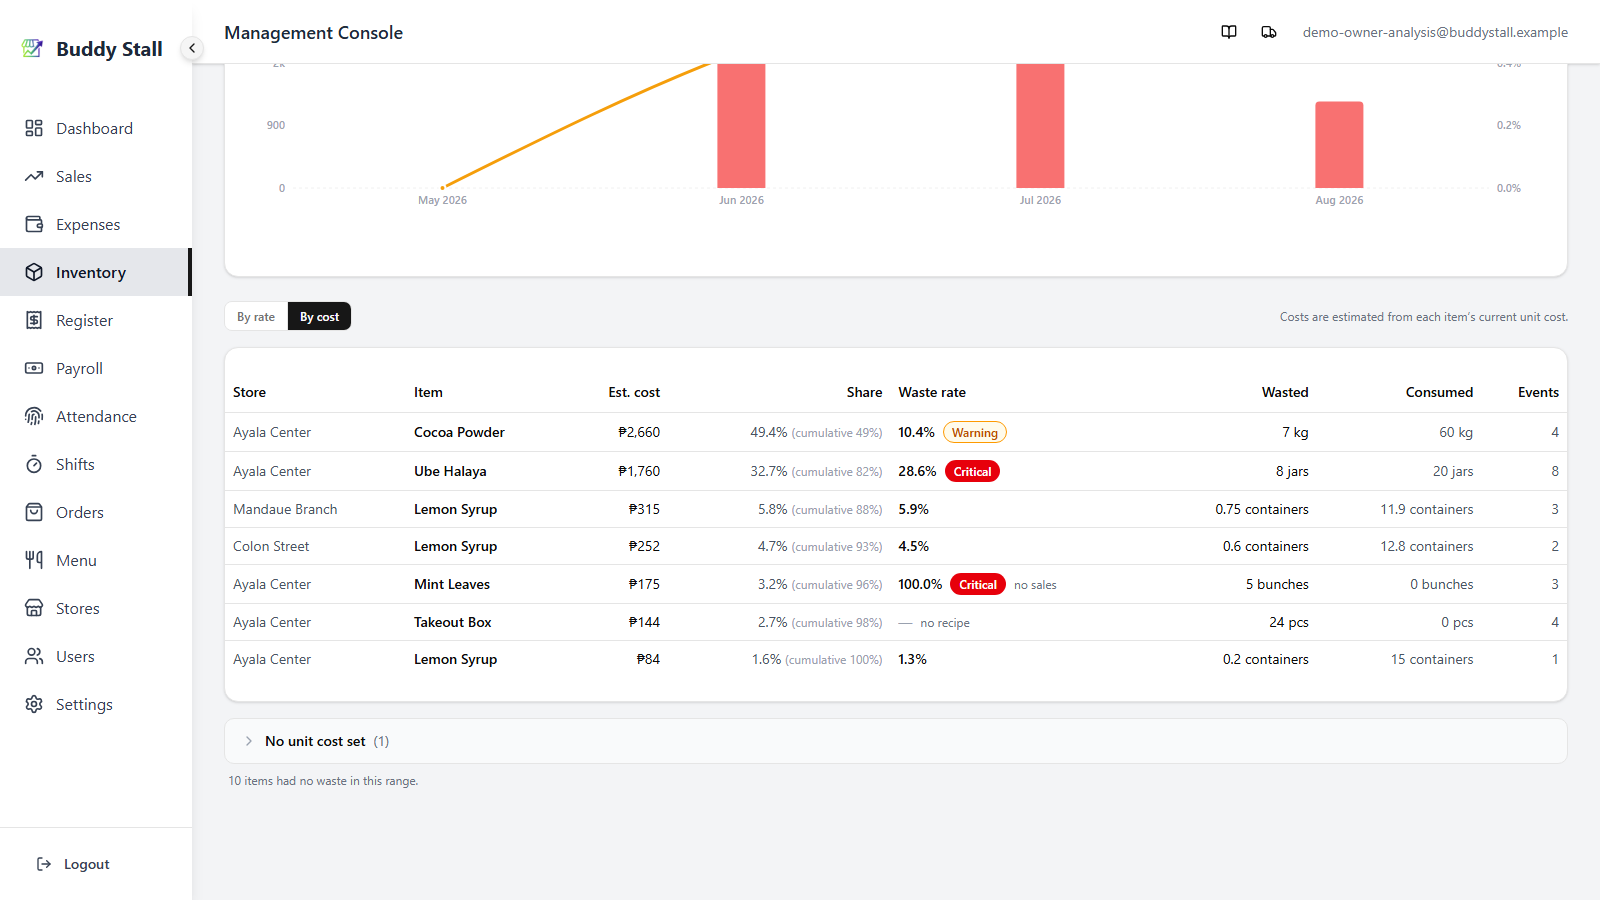
Switching to By cost reorders the same items by money and adds a Share column, with a running cumulative figure beside it, so you can read the ranking the way you would a Pareto chart: often a handful of items account for most of the loss.
 12
121 Est. cost leads the table here, because it is what the view ranks by.
2 Share — this item's share of the ranked total, and the cumulative figure down to this row.
Money carries no severity badge. Whether ₱500 of waste is alarming depends
entirely on the size of the store, so the tab shows shares rather than pretending
there is a universal threshold. Every amount is estimated at the item's current
cost per unit and marked Est.
Items neither view can rank
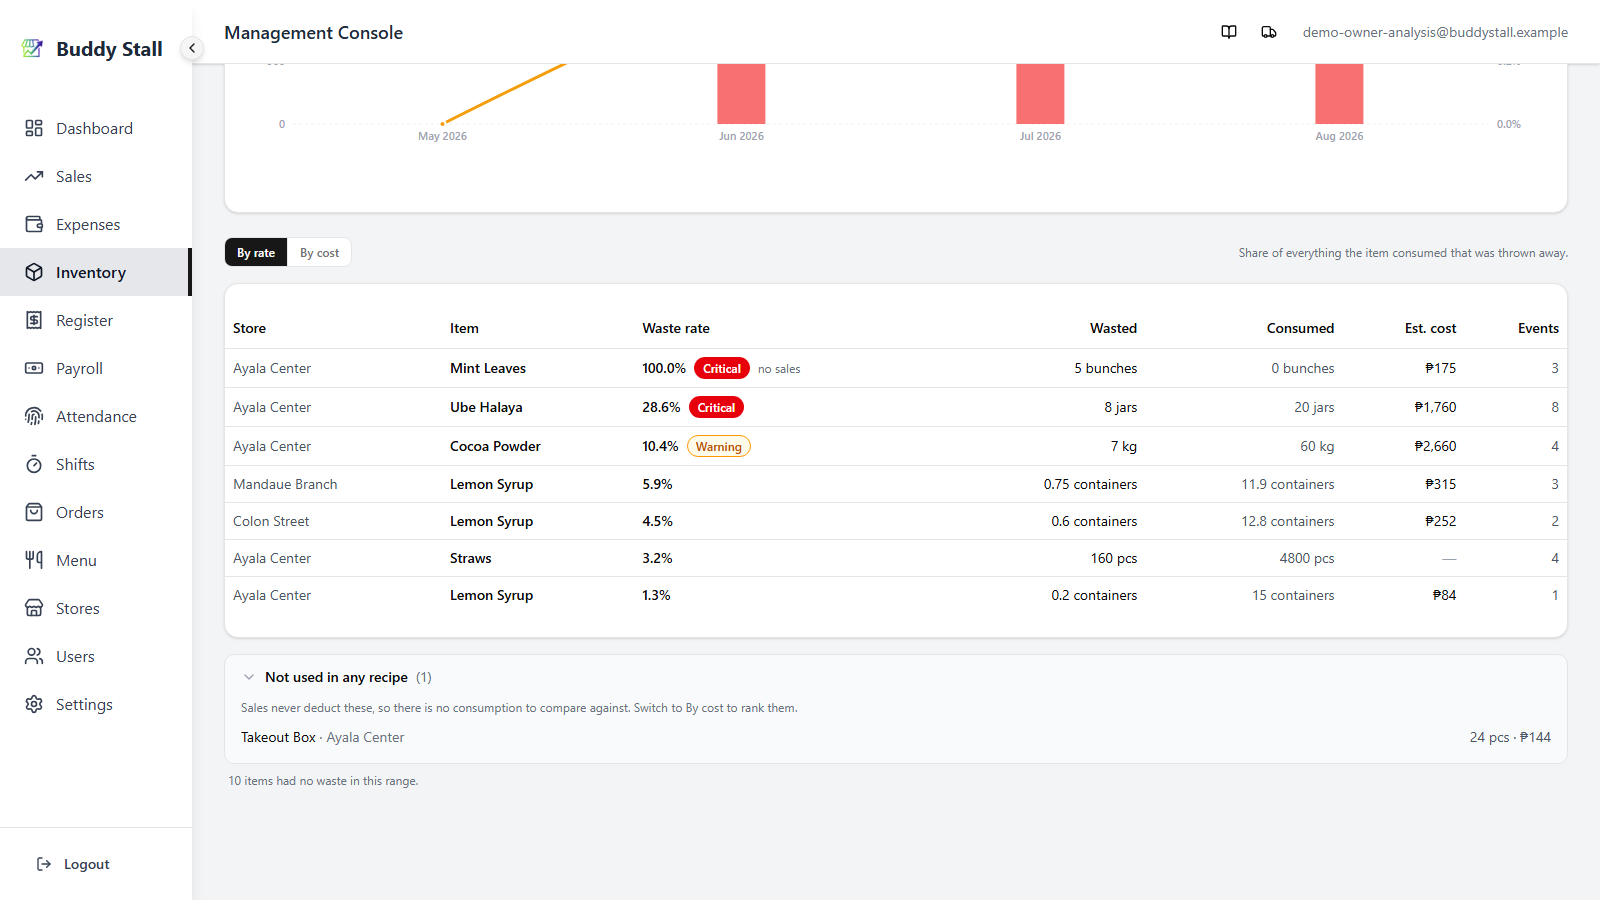
At the bottom of the tab, collapsible groups hold the items each view cannot order — with the reason, and a pointer to the view that can. Not used in any recipe appears under By rate: sales never deduct these, so there is no consumption to compare against and the rate would be meaningless; rank them by cost instead. No unit cost set appears under By cost: the loss cannot be priced, so either set a cost per unit on the master item or rank them by rate.
A line underneath counts the items that simply had no waste in the period — the healthy majority on most stores, and the reason the ranking stays short.
One item across your stores
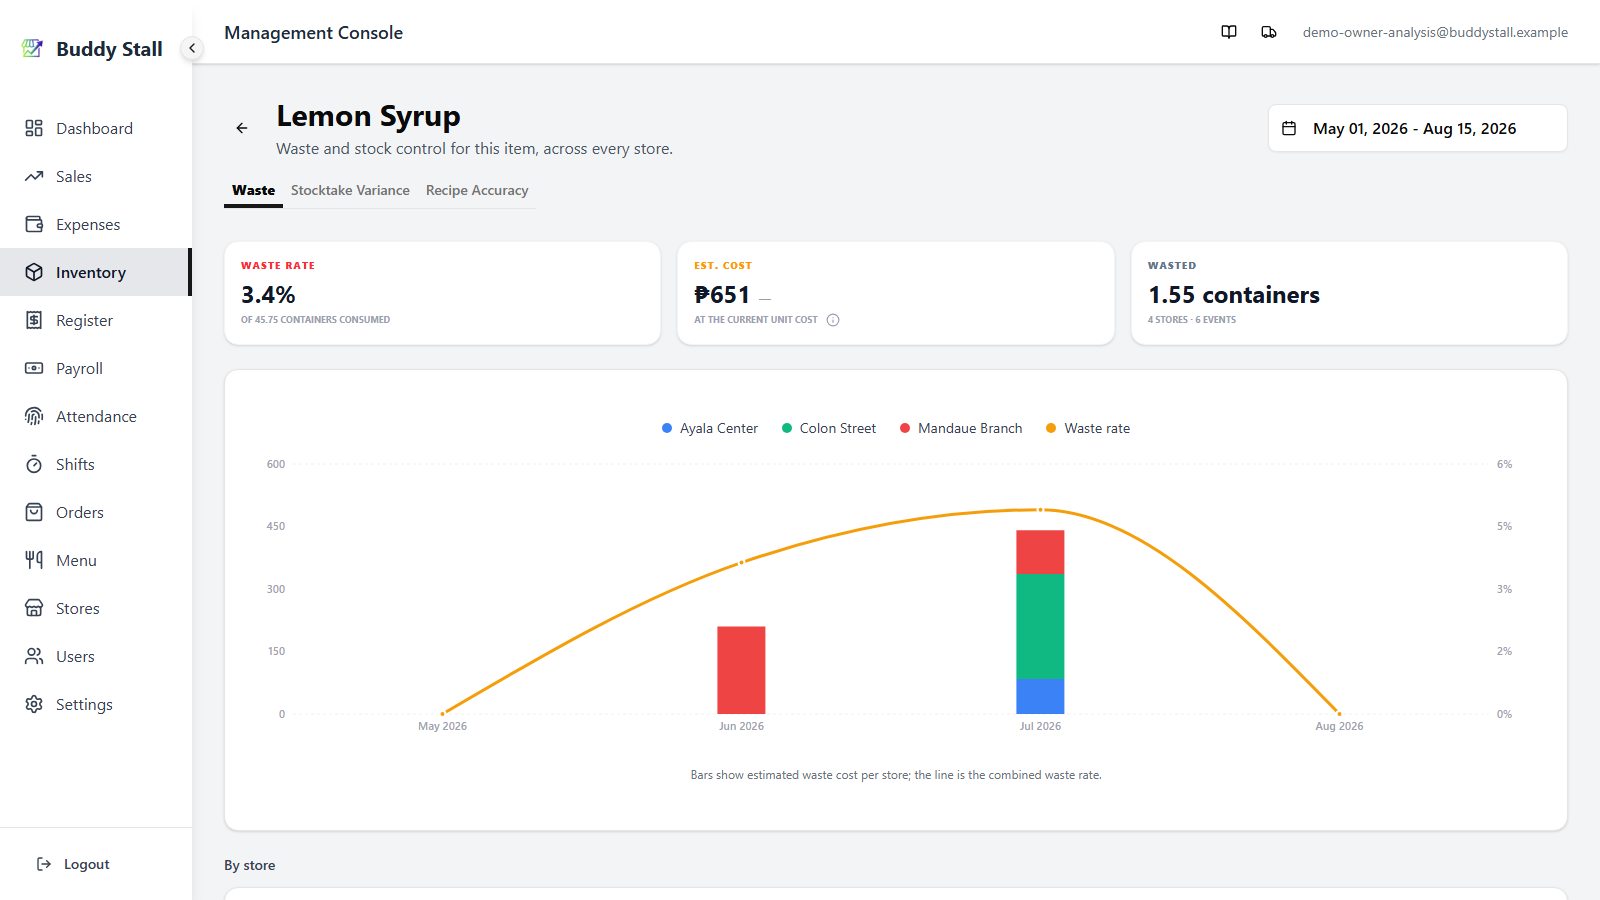
Clicking a row opens the item's own screen on its Waste tab, covering every store that carries it. Two rows for the same item in different stores therefore land on the same place.
 1234
12341 Waste Rate — the item's rate across every store, on the same basis as the ranking, with the quantity it was measured against underneath.
2 Est. Cost — that waste priced at the current unit cost.
3 Wasted — the quantity thrown away, and how many stores and entries it came from.
4 Waste over time — bars stacked by store with the combined rate as a line, so a spike can be traced to the store that caused it.
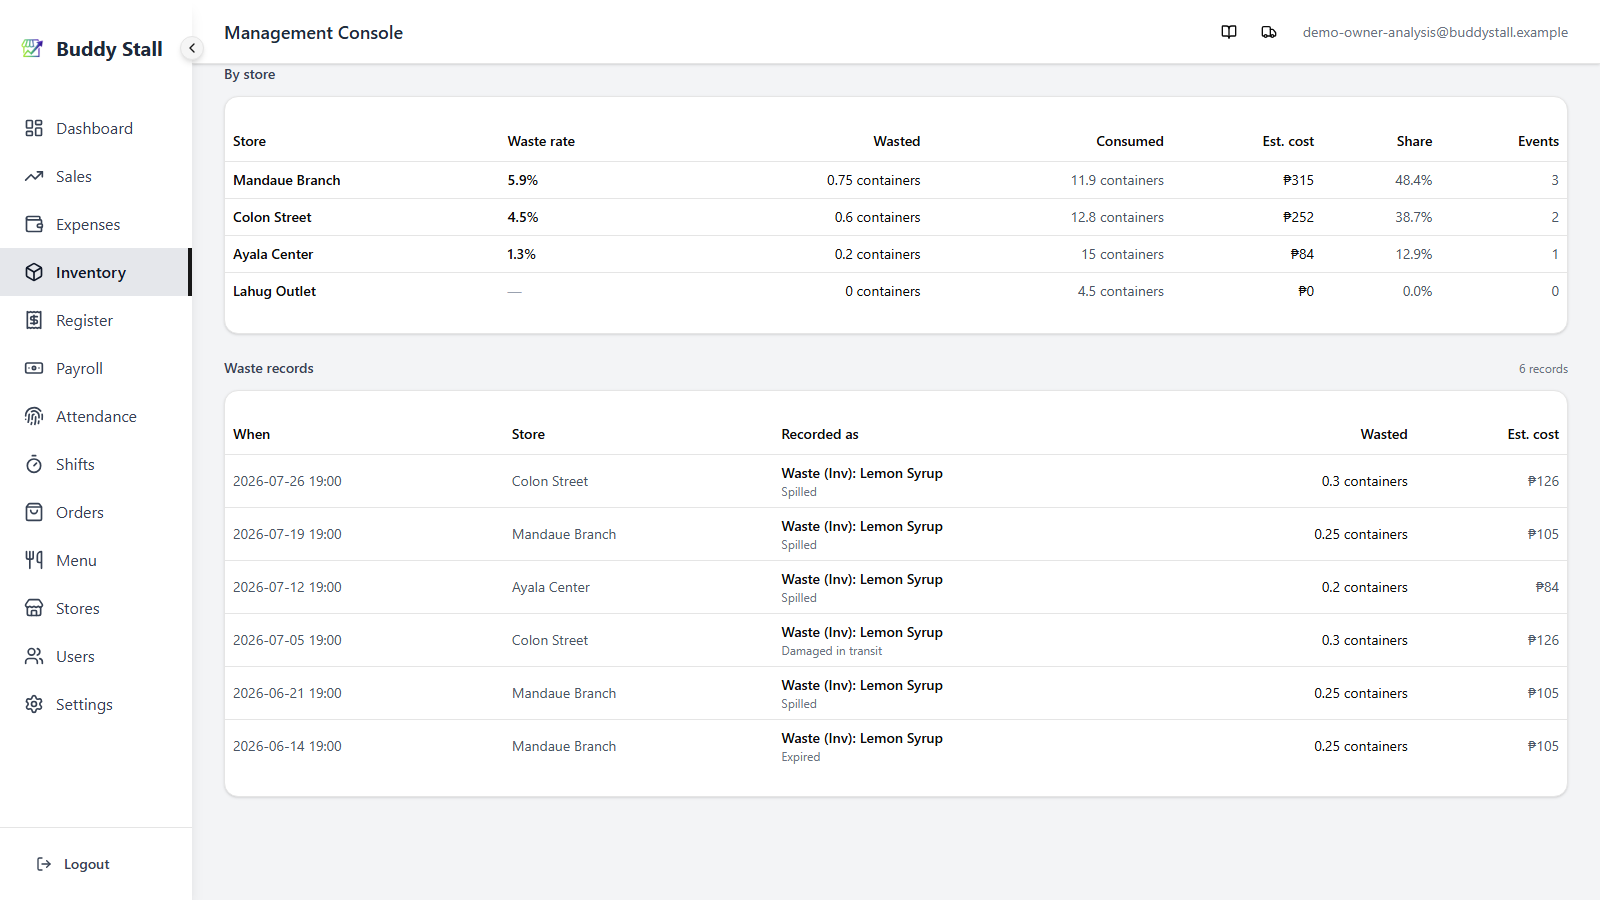
Scrolling past the chart reaches the two sections the figures above are built from — the per-store breakdown, and the individual entries.
 12
121 By store — one row per store, carrying the same figures as the ranking plus each store's Share of this item's waste, worst rate first. A store that carries the item but wasted none of it still gets a row, with a dash in place of a rate.
2 Waste records — the individual entries, counted beside the
heading. Recorded as names the expense the loss was booked under, which is
what tells ingredient waste and a thrown-away menu item apart:
Waste (Inv): Lemon Syrup came from the inventory list, while
Waste: Cheeseburger was a finished item whose whole recipe was deducted. The
reason typed at the time sits underneath.