
Stocktake variance
Every stocktake records two numbers: what you counted, and what the app expected. The difference between them is the gap. One gap is an incident; this tab looks at all of them together and asks which items your counts can and cannot be trusted on.
A gap on its own only says the shelf and the app disagree; the figures here are what narrow it down. An item flagged over and over usually means the counting routine or a recipe portion that no longer matches the kitchen. One large gap on a single day usually means a delivery or a waste entry nobody recorded. Theft is what is left when neither reading fits and the records are sound.
The ranking
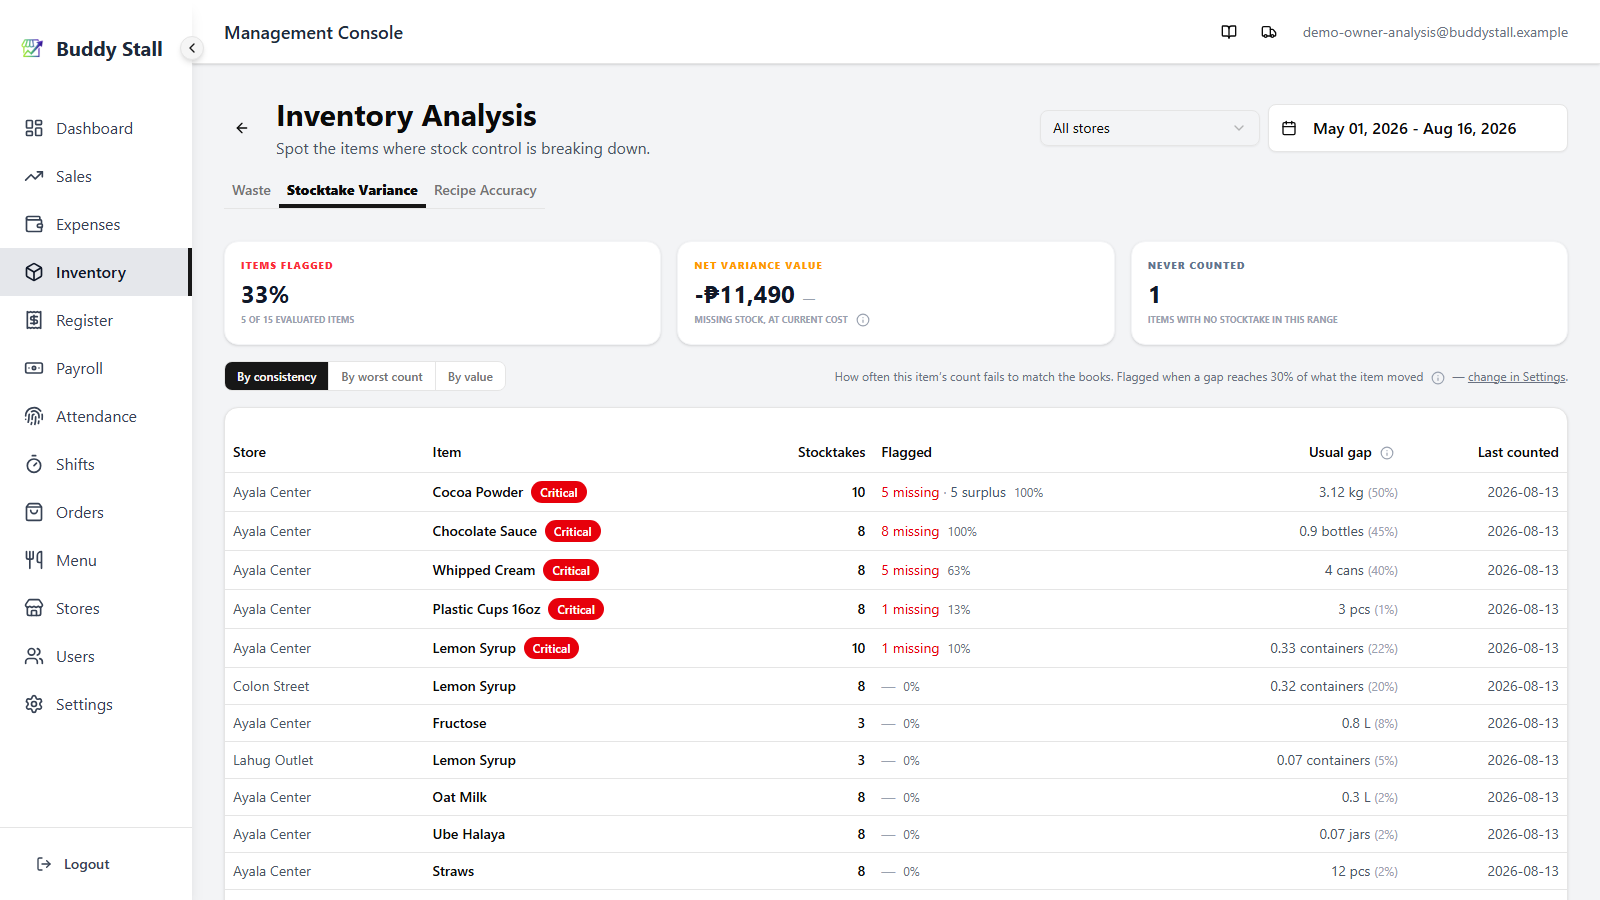
Three summary counters, a toggle that swaps the ranking axis, and one row per item per store.
 1234
12341 Items Flagged — the share of evaluated items carrying a badge. What it counts is items; the Flagged column in the ranking counts individual stocktakes.
2 Net Variance Value — what the period's gaps come to in pesos at today's cost, shortages and surpluses cancelling out. The line underneath says which way it landed, and this is the only card compared against the previous period.
3 Never Counted — items with no stocktake in the period at all.
4 The view toggle — three ways to order the same rows, one per section below. Beside it sits the rule every percentage on the tab is measured against. The severity badge belongs to the item, not the view, so it stays put as you switch; only the ordering and the columns change.
Whether a single count is flagged is decided by exactly the rule the stock discrepancy alert uses — same threshold, same denominator, same evaluation — so the two can never disagree about a given count. See how the size of a gap is decided for the rule itself; the link beside the toggle jumps straight to the threshold in Settings → Notifications.
A badge comes from two questions asked separately — how often an item's counts are flagged, and how big its worst one was. No single statistic carries both, so each is measured on its own and either one alone earns the badge. An item that meets both takes the worse of the two.
Warning
- How often
- A quarter of counts flagged — roughly one in four.
- How big
- One count at twice the flag ratio — a 60% gap, at the 30% default.
Critical
- How often
- Half of counts flagged — flagged more often than not. Needs at least three counts before it can be judged.
- How big
- One count at three times the flag ratio — a 90% gap, at the 30% default.
By consistency
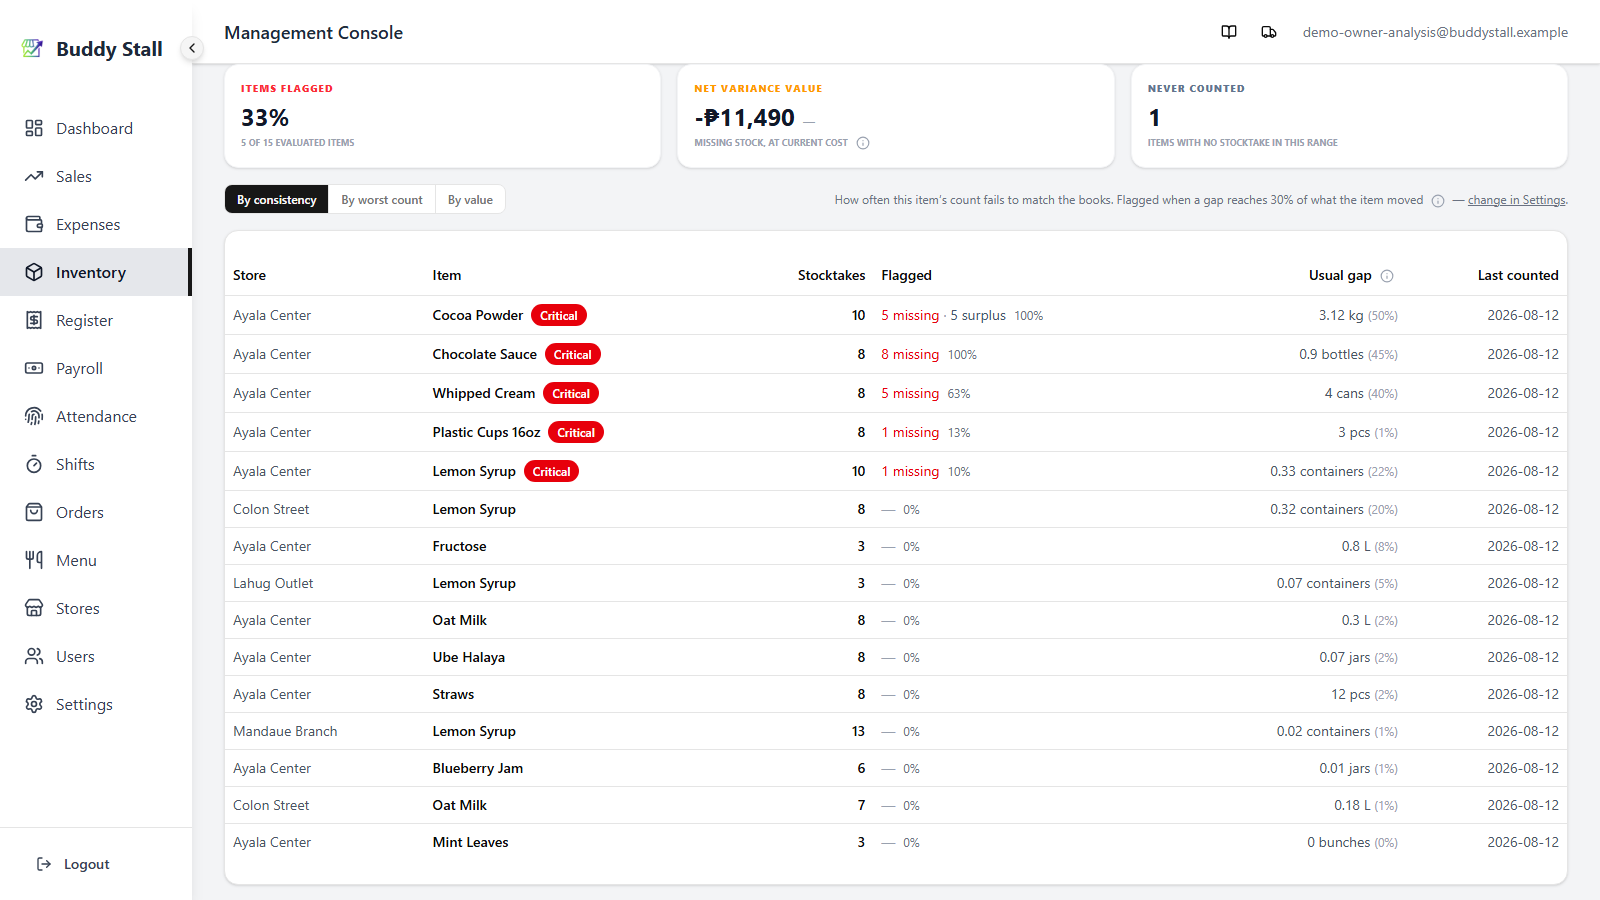
Which items are flagged most often. This is the view the tab opens on.
 123
1231 Stocktakes — how many counts were evaluated. It is the
denominator for everything to its right, which is what stops 3 missing reading
as a quantity.
2 Flagged — the flagged counts split by direction, with the
share beside them. A row reading 5 missing · 5 surplus is an item whose counts
land on both sides.
3 Usual gap — the median gap across every count in the period, clean ones included, with its percentage.
By worst count
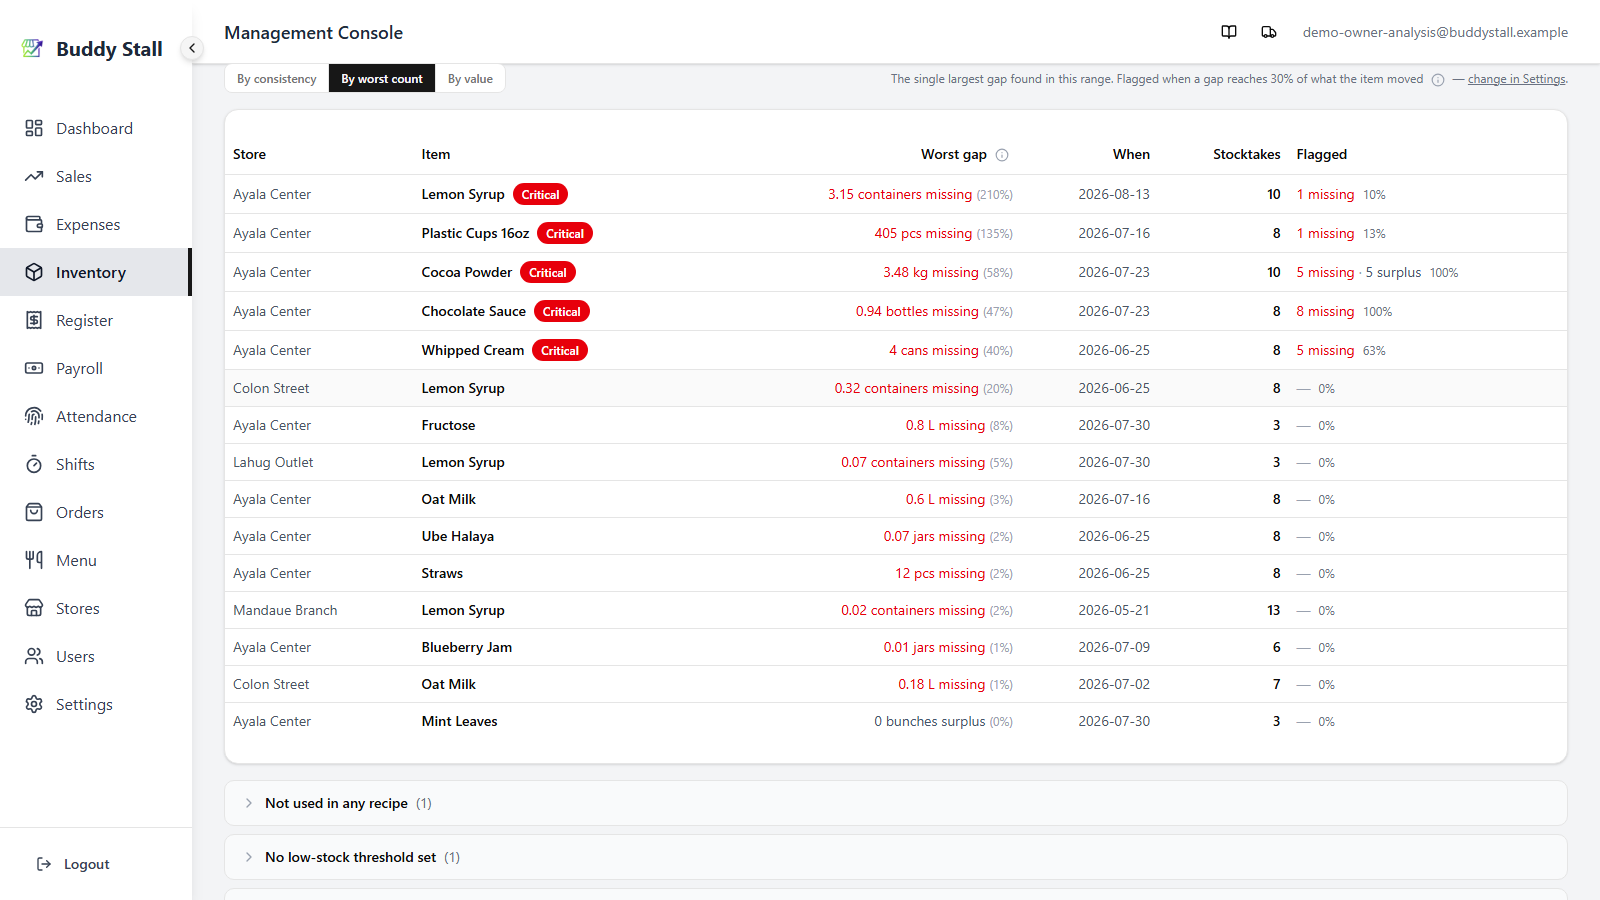
Which items lost a lot at once. An item can count cleanly nine times out of ten and still belong at the top here.
 12
121 Worst gap — the largest single gap, in place of Usual gap and leading the table because it is what this view ranks by. A gap of 100% means that count was off by as much as the item used in the whole period, so the 210% on the top row is a count whose gap was twice everything that moved. Read it next to Stocktakes, since a store that counts often has more chances to record a big one.
2 When — the date that worst count was taken. A gap from five months ago and one from last week call for different responses.
By value
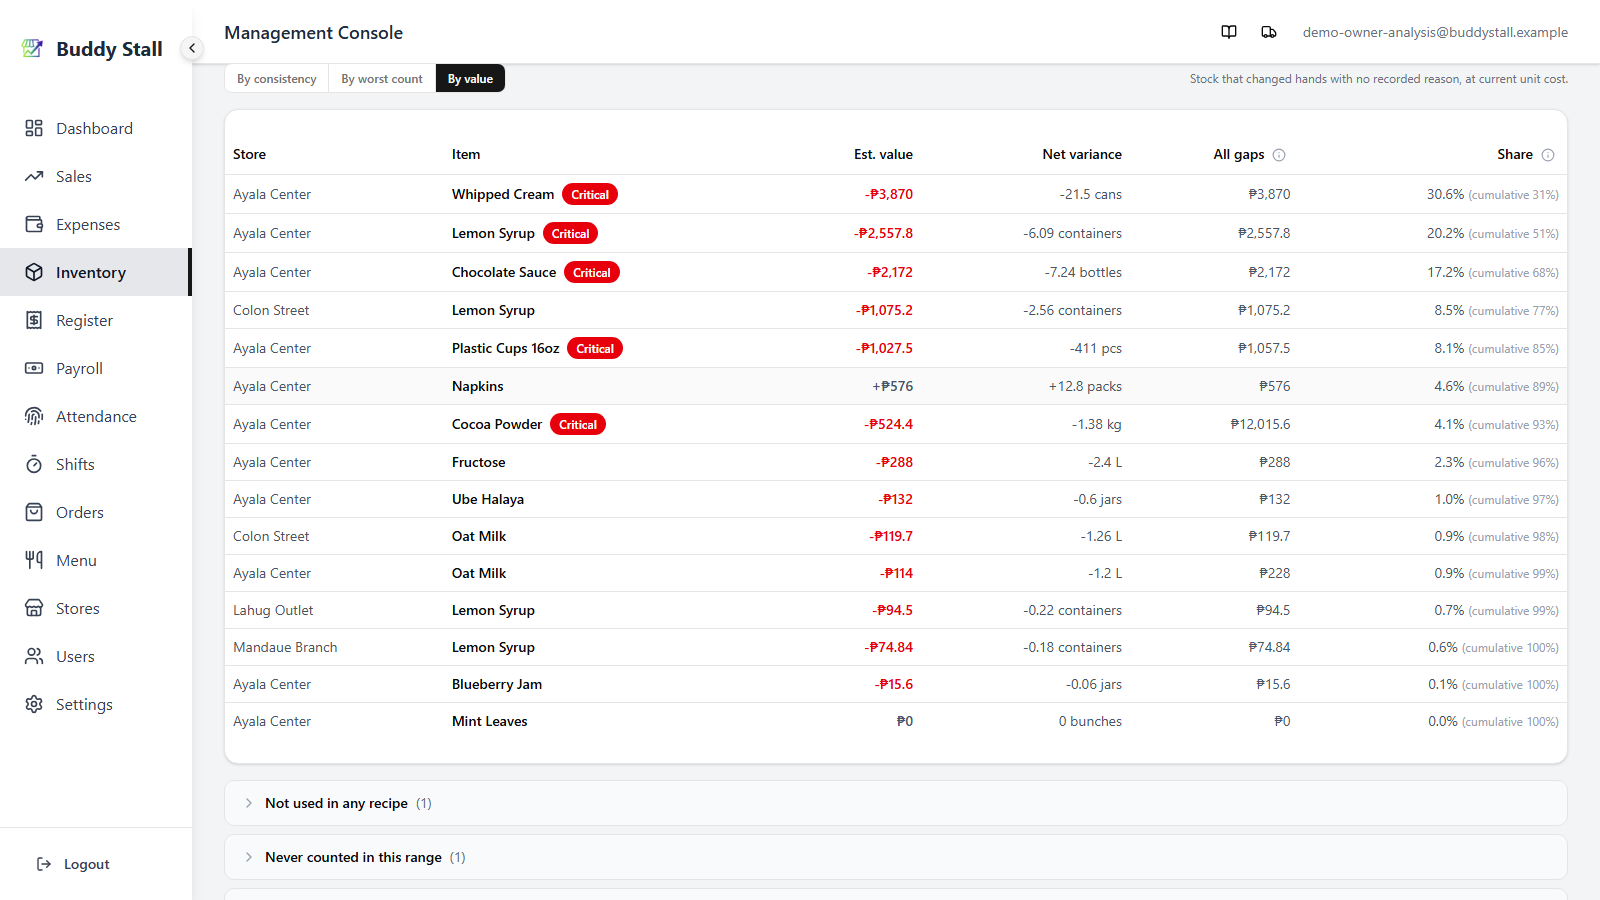
What the gaps are worth.
 1234
12341 Est. value — the signed total, priced at today's cost. Red is missing stock, slate is surplus.
2 Net variance — the same total as a quantity instead of pesos. Shortages count as negative and surpluses as positive, so the two cancel: they offset each other and only what is left over shows.
3 All gaps — the same gaps added up by size alone, ignoring whether each one was a shortage or a surplus. Nothing cancels here, so it is never smaller than Net variance.
4 Share — how much of the ranking's total this row accounts for, by that same size: its value with the sign dropped, against the sum of every row's. The figure beside it is the running cumulative down the table.
This pair is the most diagnostic thing on the tab. Ten litres missing on one count and ten litres surplus on the next is 20 L under All gaps and zero under Net variance.
- Close together — the item drifts one way. That points at a cause: a recipe amount that is off, or stock leaving unrecorded.
- Far apart — the counts swing to both sides and cancel out. That points at the routine rather than at the stock. Counting a shelf before the delivery that filled it was entered comes back as a surplus, then as a shortage once that delivery lands — the same stock counted twice in the wrong order. A quantity keyed in wrong does it too.
Surplus is ranked by size, not by sign, so it is never buried at the bottom. Stock that arrived without being recorded is a real finding — usually a delivery that was never entered — and the direction is carried by colour instead of by position.
Items a view cannot rank
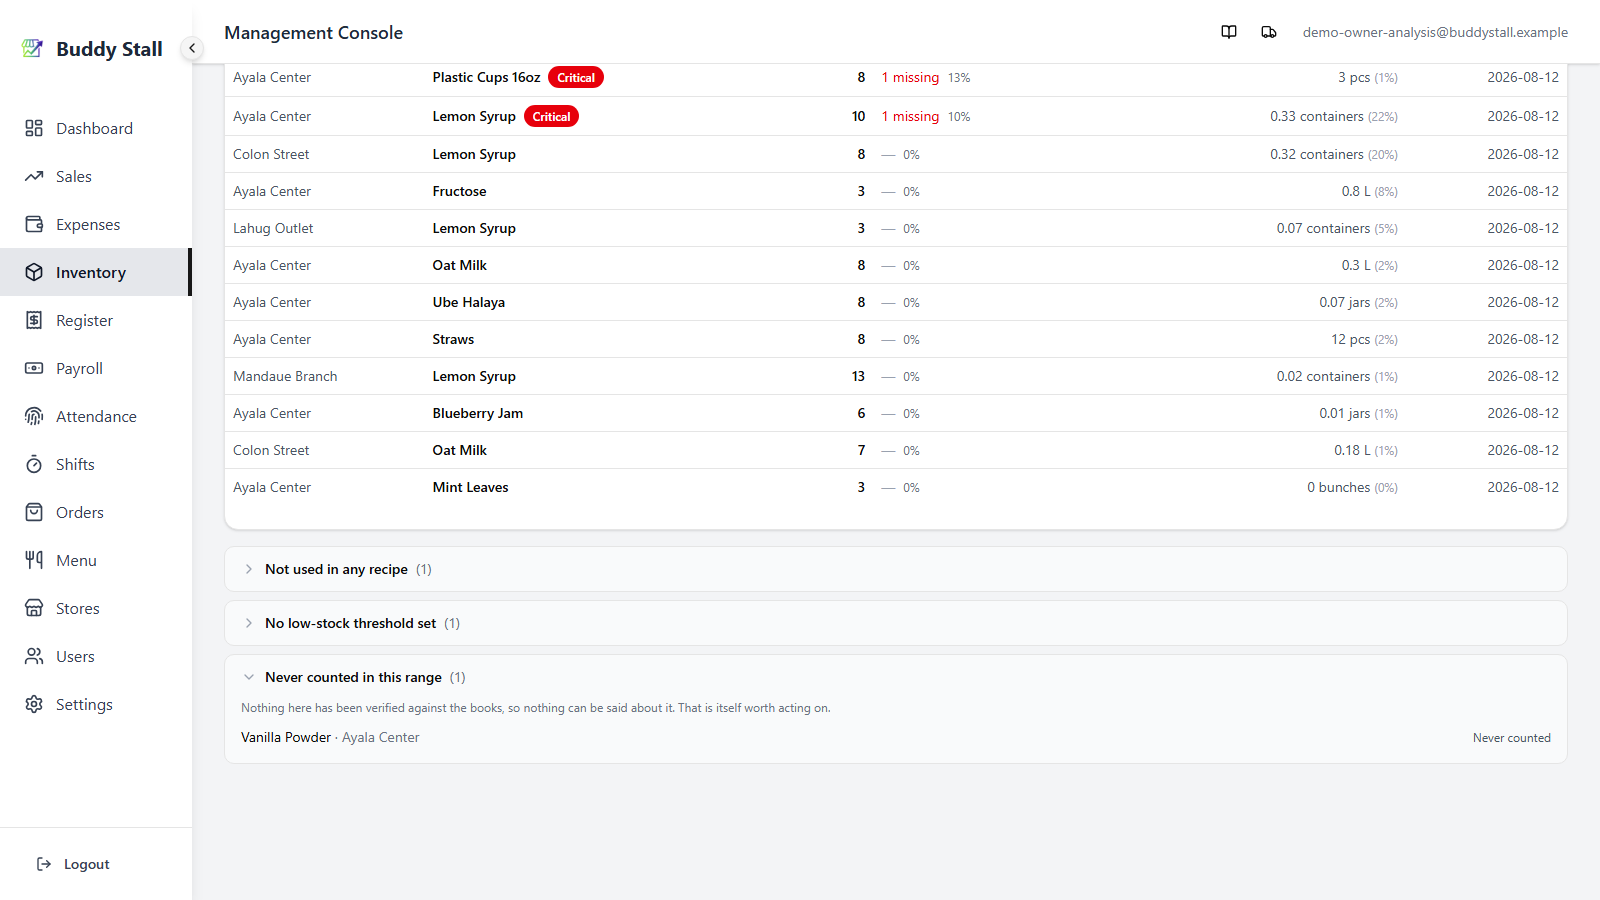
Four groups collect what each view has to leave out. Not used in any recipe is excluded from all three views. No low-stock threshold set drops out of the two percentage views but ranks fine by value, since the threshold only ever protected the ratio's denominator. No unit cost set is the mirror image: the gap is real but cannot be priced, so rank it by consistency instead. Never counted in this range shows when each item was last counted ever, because "never" and "five months ago" call for different responses.
One item across your stores
Clicking a row opens the item's own screen on its Stocktake Variance tab, which carries two charts and no restatement of the ranking.
Net variance by store puts one bar per store on a single shared axis, so the stores are directly comparable. Below the line is stock the app expected and could not find; above it, stock that arrived without being recorded. The axis is money where a unit cost exists and quantity where it does not, and the caption above the plot says which. A store sitting on the zero line is not necessarily counting well — it may be losing and finding stock in equal measure, which is what the charts underneath reveal.
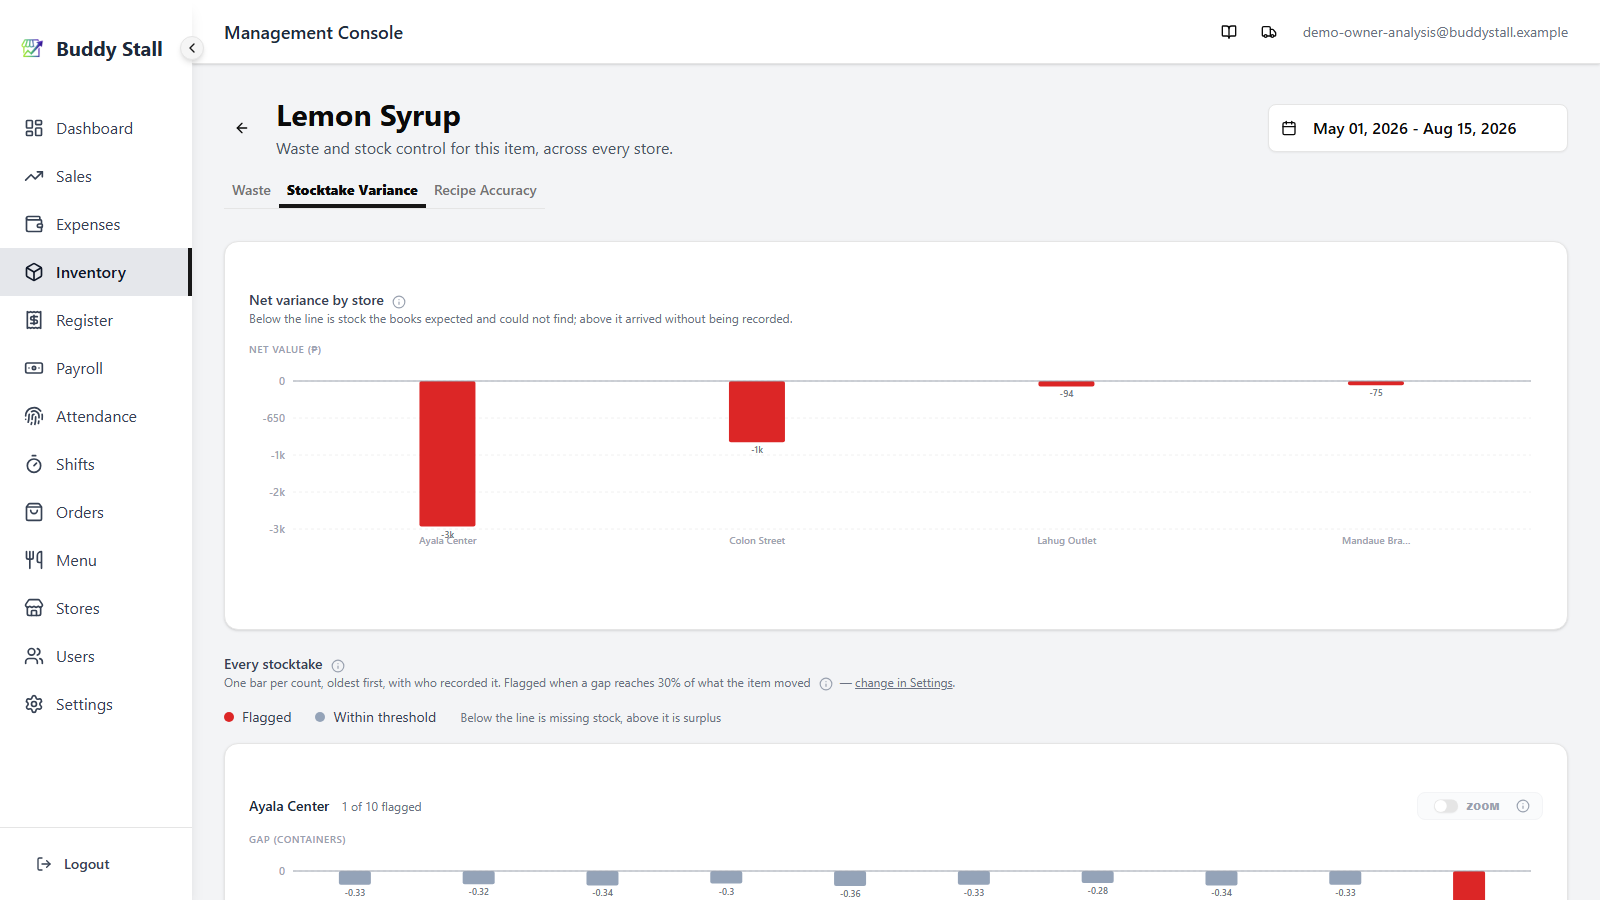
Every stocktake then gives each store its own chart, one bar per count, oldest first.
 123
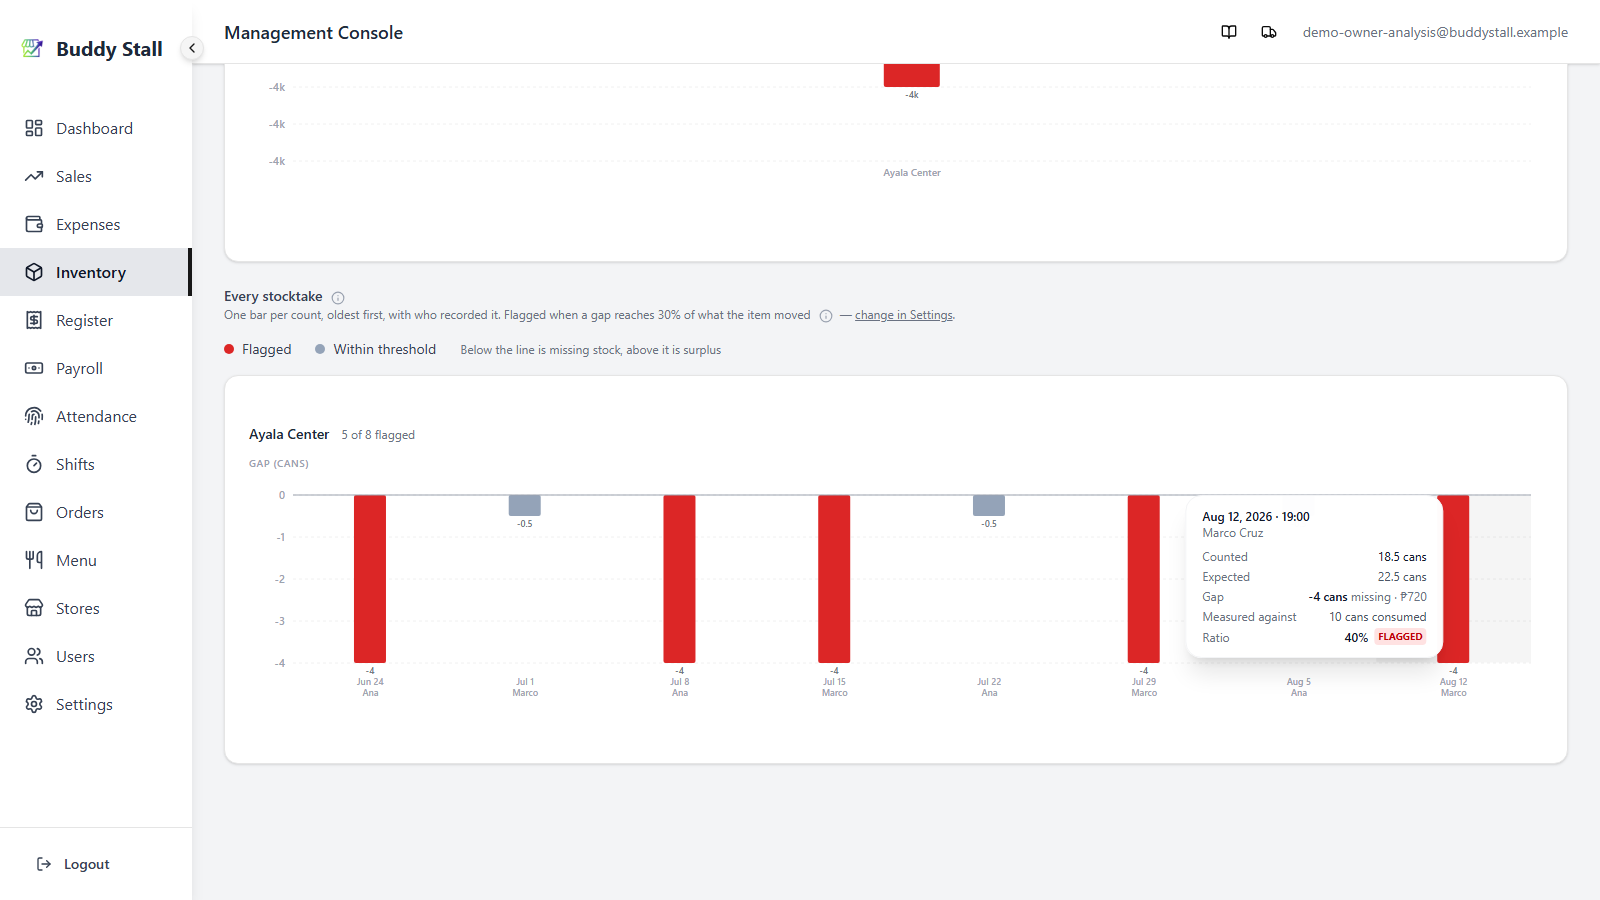
1231 Flagged and clean counts — flagged counts are drawn in red, counts within the threshold in grey, so which ones rang is readable without hovering. Each bar also carries its gap as a label, which matters on a phone where hovering does not exist.
2 When and who counted — the date sits under each bar and the person
who recorded it on a second line. It reads — where no employee was recorded on
the count.
3 The tooltip — date and time, who counted, Counted,
Expected, Gap with its value, Measured against, and Ratio.
Measured against is the line worth knowing about: it prints the actual
denominator for that one count — 48 pcs consumed or 20 pcs threshold — and
names which of the two applied. The ranking's percentages talk about "what the
item moved"; this is where you see, count by count, exactly what that was.
The per-store charts are scaled to their own counts, so bar heights are not comparable between cards — read the numbers on the bars. Cross-store comparison is what the chart above is for, on one axis. This split exists because one store's extreme count used to flatten every other store's ordinary gaps into slivers.
A Zoom toggle appears on any store whose ordinary range is being squashed by an extreme count. It rescales that store alone; the extreme bars then run past the edge rather than being dropped, and their values stay in the tooltip.
Long histories are capped at the latest 500 counts, and the chart says so when
that happens. Items no recipe consumes are still charted — the gaps are real
numbers — but with a notice above them, and their Ratio reads — for the
same reason the ranking excludes them.
This tab carries no severity badges. A badge here would be computed across every store, while the ranking's badge is per store, and two different-looking results for the same item would read as a contradiction. Which counts were flagged is carried by the red bars instead.