
Recipe accuracy
Every sale deducts stock using the amounts set in your recipes. A stocktake then says what is actually on the shelf. When the two disagree in the same direction, again and again, the amount your recipes are set to and the amount actually being used have drifted apart.
How the gap is measured
Between two stocktakes, the tab works out two quantities for an item and compares them:
- What the recipes predicted — every sale in between, deducted at the amount its recipe sets.
- What the shelf actually lost — the fall between the two counts, with restocks added back and any logged waste set aside. What remains is what serving customers used.
One against the other is the gap: 20% more used than the recipes say, or 5% less. A single gap proves nothing; it is whether the same gap comes back that tells you the recipe amount is wrong.
That comparison only means something when enough of the item moved in between. So counts are merged forward until the recipes predict enough movement to clear a floor: the item's own low-stock threshold, the quantity you have already called worth noticing. That merged run is a stretch, and it — not the individual stocktake — is what everything here is measured over. A stretch never runs longer than 60 days.
A stretch that sits far from this item's own others is left out of the figures. The bar is the item's usual spread rather than a fixed percentage, so an item that always runs 40% over the recipe is not set aside for doing it again — while a steady item with one wild stretch is. A recipe amount is applied to every sale, so a one-off is a question about the records behind that stretch, not about the recipe; Stocktake variance is the tab for it. Nothing is set aside below five stretches, or on an item whose stretches all agree exactly — and what is set aside is still drawn on the charts.
The four results
Everything on this tab says one of four things about an item, in the same words every time.
Likely off the recipe
The item runs about the same amount above or below the recipe every stretch. A gap that steady is what a wrong amount looks like. This is the only result the app grades with a badge.
What to do Review the amount set for this item in the recipes that use it, and check that what is actually being used matches it in practice.
Looks fine
Counts and deductions agree, closely and consistently. What the shelf lost is what the recipes said it would.
What to do Nothing. This is the result to aim for.
Stock records look incomplete
The gap swings a lot from stretch to stretch. A recipe amount is applied to every sale, so an amount that is wrong is wrong every stretch — a gap that comes and goes points at something not being recorded instead.
What to do Check that waste is logged when it happens, that deliveries are entered with the right quantity, and that the count itself is done carefully. Not the recipe.
Not enough stocktakes yet
Fewer than five usable stretches, so nothing is claimed about the item either way.
What to do Count the item more often. This is the one result that fills itself in.
The groups on screen run in this order too: the result the tab exists to answer leads, and the rest descends towards the ones that cannot answer it yet.
The three counters
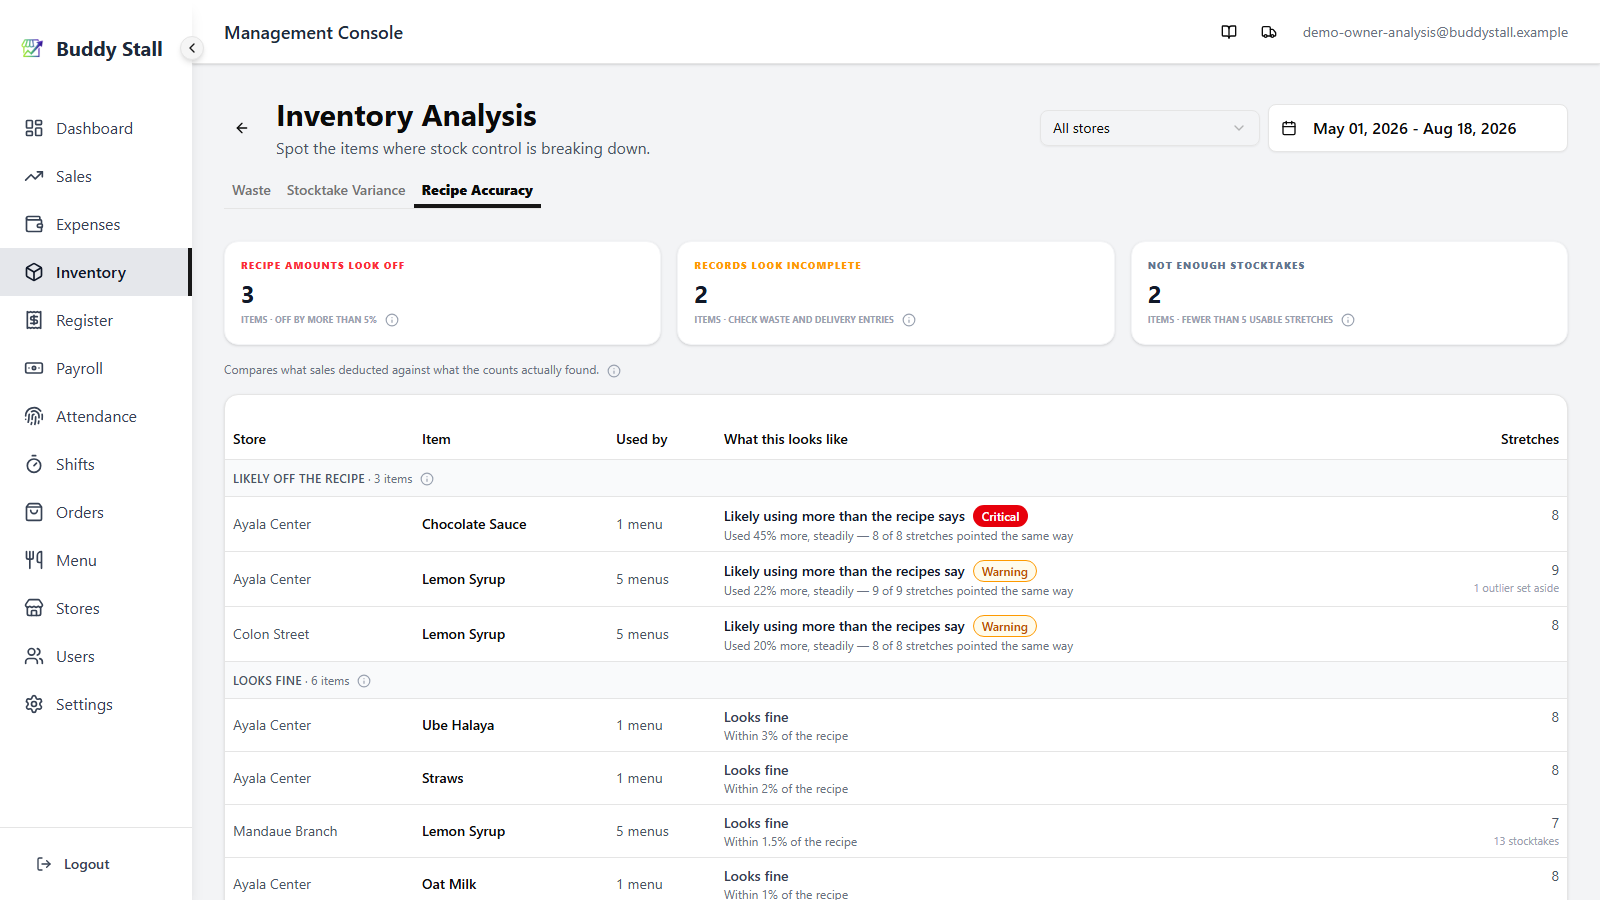
The tab opens on three counters, one per finding worth acting on.
 123
1231 Recipe Amounts Look Off — items whose result is Likely off the recipe.
2 Records Look Incomplete — items whose result is Stock records look incomplete.
3 Not Enough Stocktakes — items whose result is Not enough stocktakes yet.
The ranking
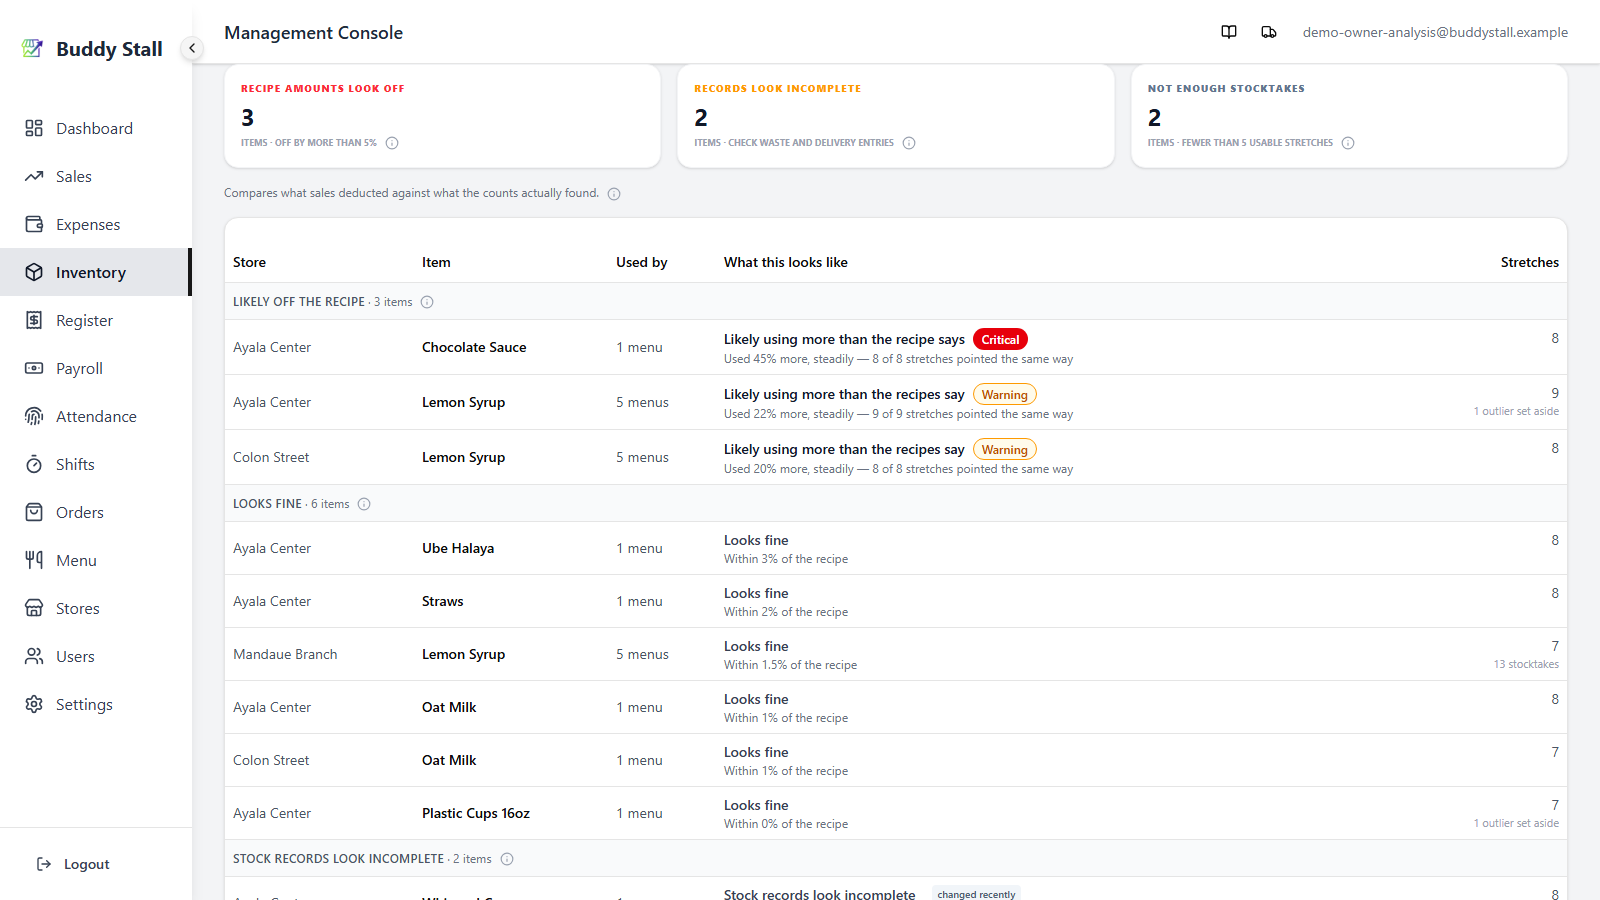
Rows are grouped by result rather than ranked in one list, because the groups call for different actions.
 123
1231 The group heading — one per result, in the order set out under the four results. Every item sits in exactly one of them, and the count beside each heading is the counter above it.
2 The result, its badge, and the evidence beneath it — the sentence names the direction, and switches between the recipe says and the recipes say depending on whether one menu or several use the item (the Used by column counts them). Where several do, no single recipe can be blamed. The badge grades how far off the amount is: nothing below 15%, where the sentence reads slightly; Warning from 15%; Critical from 35%. Colour on this tab means severity and nothing else — the result itself is carried by words, so a red mark always means the same thing, and the other three results never carry one.
The smaller line underneath is the evidence for that result, written as a sentence rather than as statistics:
Used 52% more, steadily — 6 of 7 stretches pointed the same wayis a large gap that reproduces, with the agreement in direction spelled out.Within 4% of the recipesits inside the noise band.Used 41% more, but the amount swung by ±58% between stretcheshas a large average and an even larger scatter — records, not recipe.3 usable stretches · needs 5is not a result yet, and says how far off one is.
A changed recently chip can follow the sentence when the most recent
stretches sit somewhere different from the period as a whole. It is
informational only and never raises a badge — it also lights up when a
correction you have made is starting to work.
3 Stretches — how many measurable stretches the result
rests on. Two notes can sit beneath it: N stocktakes when the stretches
were built from more counts than there are bars (five stretches built from thirty
counts is a very different sample from five built from five), and
N outliers set aside, because one freak stretch does not get to move the
figures — see which stretches get set aside.
Items the tab cannot compare
Some items cannot be measured at all, and they are not dropped for it. They collect into drawers under the ranking, each naming its reason and counting the items in it.
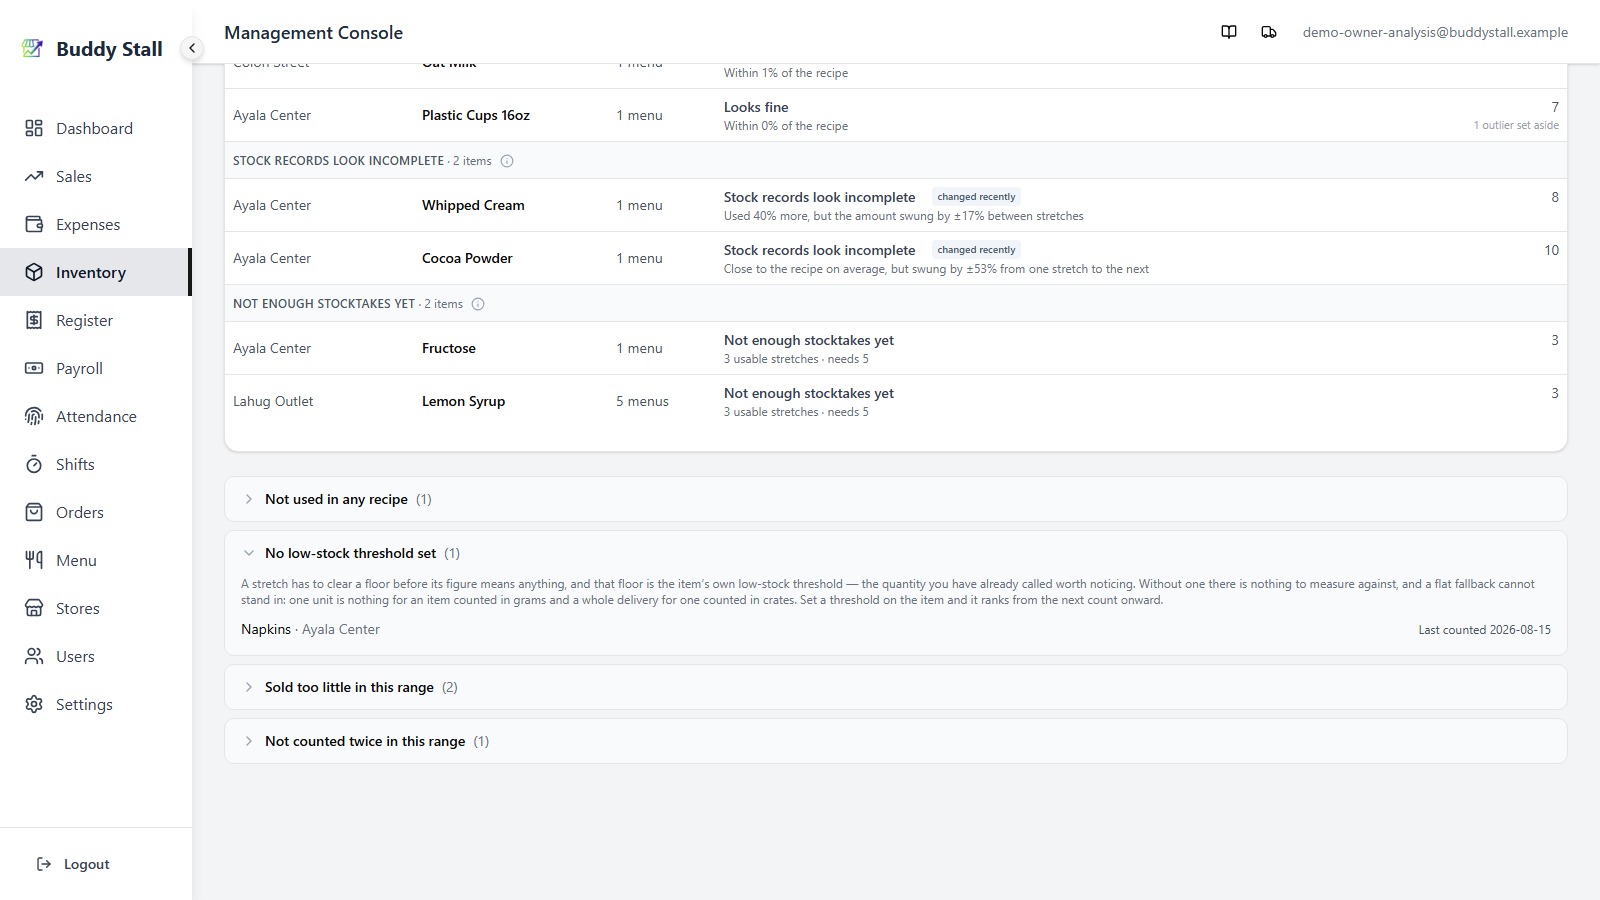
- Not used in any recipe — nothing predicts how much should have been used, so there is no figure to compare the count against.
- No low-stock threshold set — no floor for a stretch to clear. This is the only group fixed by a setting rather than by counting more often: set a threshold on the item and it ranks from the next count onward.
- Sold too little in this range — counted, but barely any of it sold in between. Normal for slow movers, and widening the date range is what helps.
- Not counted twice in this range — a stretch needs a count at each end, so one count, or none, cannot make one.
An item in a drawer is not a clean bill of health. It means the tab has nothing to say about that item yet, which is itself worth knowing — the first two groups in particular describe a gap in your setup rather than in your stock.
One item across your stores
Clicking a row opens the item's own screen on its Recipe Accuracy tab. This is where most of the answer lives.
Where the amount is set
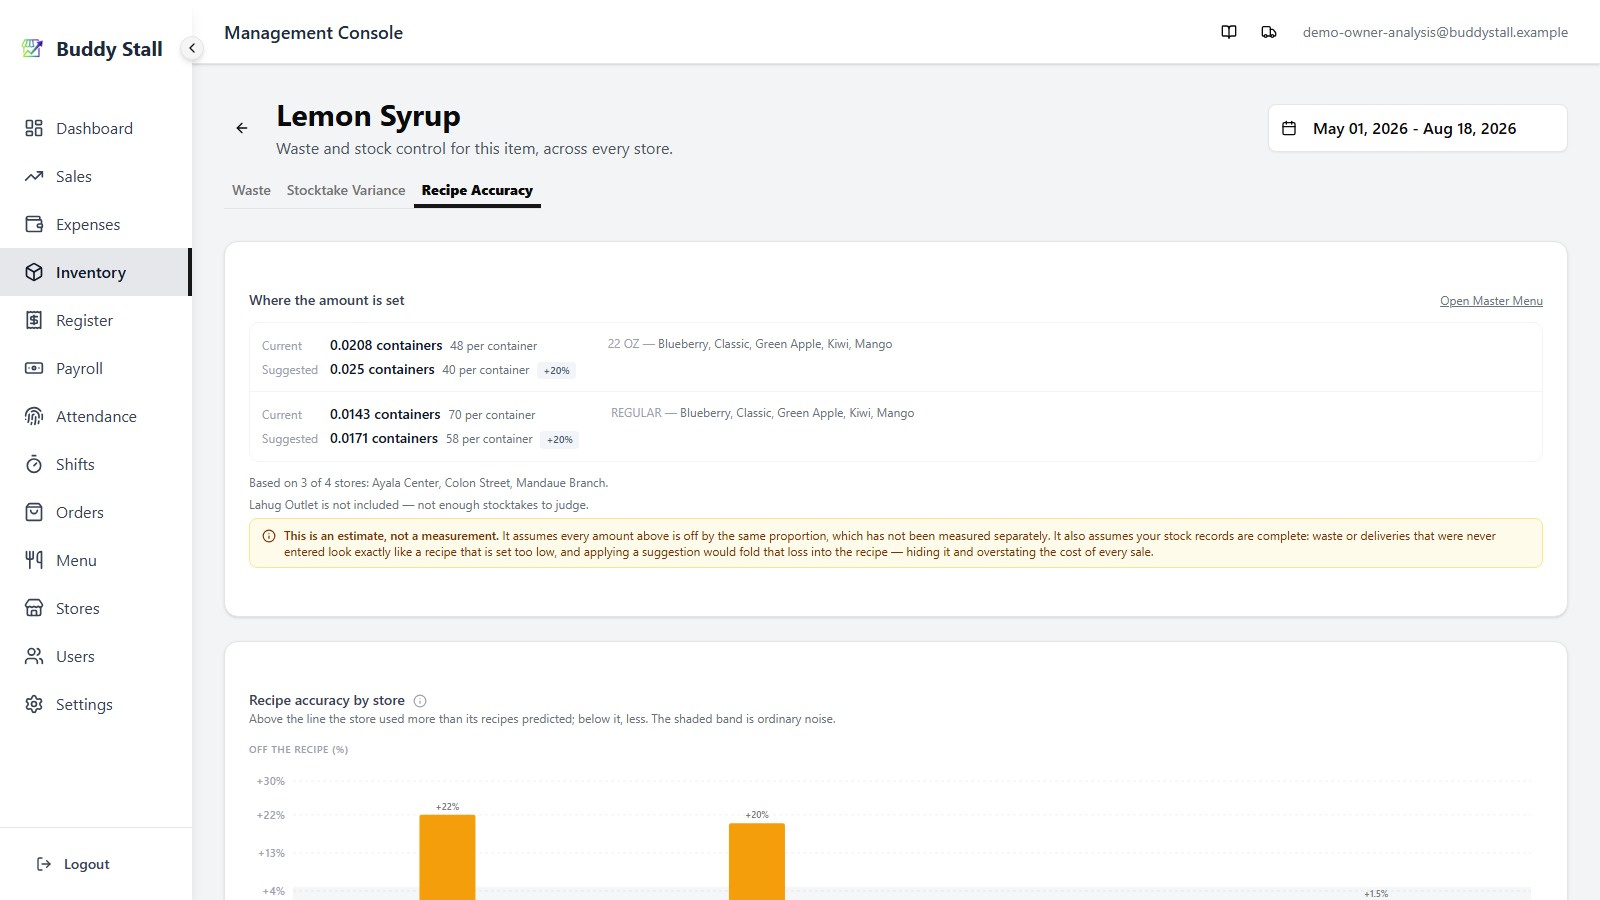
At the top of the item's Recipe Accuracy tab sit the amounts registered for this item — one row per distinct amount rather than one per recipe. Twenty recipe rows carrying two distinct amounts are two things to act on, not twenty.
 123
1231 Current, and beneath it Suggested where the
measurements support one, with the change as a percentage. Amounts smaller than a
single unit are also shown the readable way round: 0.0208 containers is the
same fact as 48 per container.
2 What uses this amount — every menu, size and add-on carrying it, written out in full, so you can see the scope of a change before making it.
3 Which stores the estimate rests on, and which were left out with the reason — a store with too few stocktakes to judge, or one whose gaps do not repeat and so say more about its records than about the recipe.
How the suggestion works
The suggestion scales the registered amount by the drift that was actually measured: if your stores used 6% more than predicted, the amount was set 6% too low.
Pooling takes the median: line the measured stores up in order and use the one in the middle. An average would let a single wild store pull the figure towards itself; the middle one cannot be moved that way, so once there are three stores no one of them decides the suggestion on its own.
Sometimes no amount is suggested at all, and the card says which case it is. The one worth reading twice is stores that drift in opposite directions — the same flow, arriving somewhere else:
Only stores outside the ±5% band get a say in the direction, so one sitting near zero never creates a disagreement on its own. When the ones that do deviate genuinely disagree, the recipe is not what to change: look at how the stores differ in handling the item, or in what they record.
It is an estimate, not a measurement. Two assumptions sit under it.
First, it assumes every amount listed is off by the same proportion. That has not been measured separately — separating them needs the size mix of what sold in each stretch.
Second, and more important, it assumes your stock records are complete. Waste or deliveries that were never entered look exactly like a recipe amount set too low. If you apply a suggestion built on that, the loss gets folded into the recipe: the gap disappears from this screen, the loss stops being visible anywhere, and the cost of every future sale is overstated.
So treat a suggestion as a hypothesis to check against the kitchen — not as a number to paste in.
Recipe accuracy by store
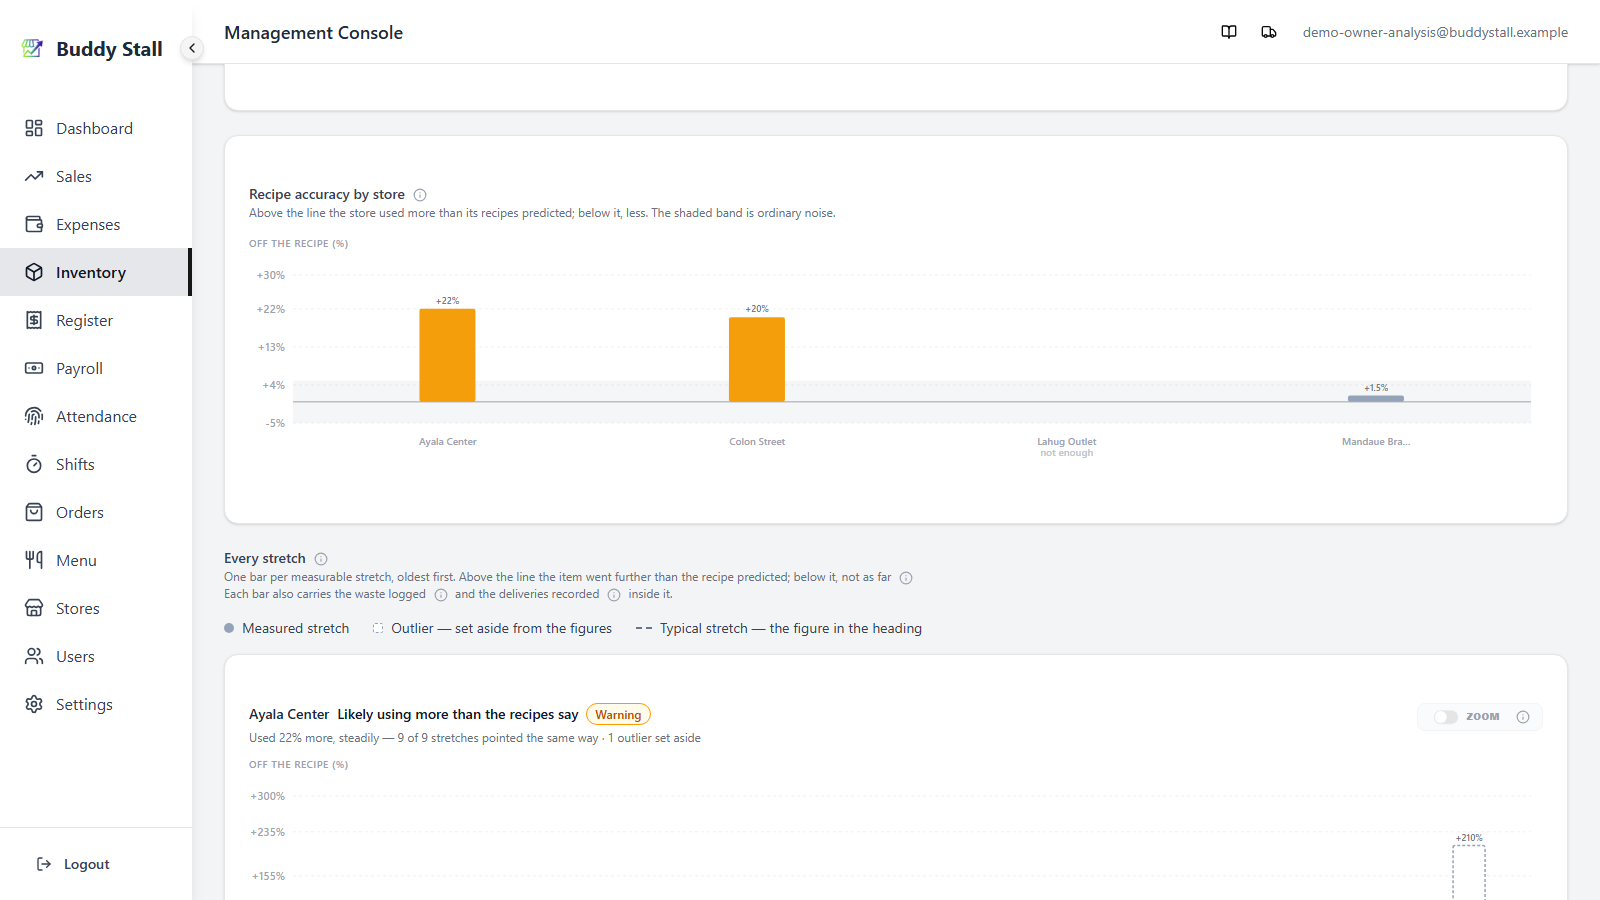
Below that card, one bar per store, all on one axis, showing how far each store landed from what its recipes predicted. This is the comparison the ranking cannot make. The ranking splits rows by result and then orders them by size, so two stores carrying the same item end up far apart on the page. Here they sit side by side — and if the same item with the same recipes is +52% in one store and +2% in another, the recipe is not what is wrong. That store is.
 123
1231 The bars — above the line the store used more than its recipes predicted, below it less. Colour is severity, matching the ranking's badges; direction is carried by the zero line, so colour is not spent on it.
2 The noise band — anything inside ±5% is ordinary measurement noise: scales round, counts happen at slightly different times of day, and a recipe amount is never exact to the gram. Shading it means you are not judging "is this within the margin?" by eye. A bar that stays inside the band is a store whose counts match its recipes.
3 A store with no result keeps its slot but draws no bar,
labelled not enough. A zero-height bar would claim it was exactly on recipe,
which is a different statement from having too few counts to judge.
The chart is skipped entirely for an item only one store carries, where it would just restate the heading below it.
Every stretch
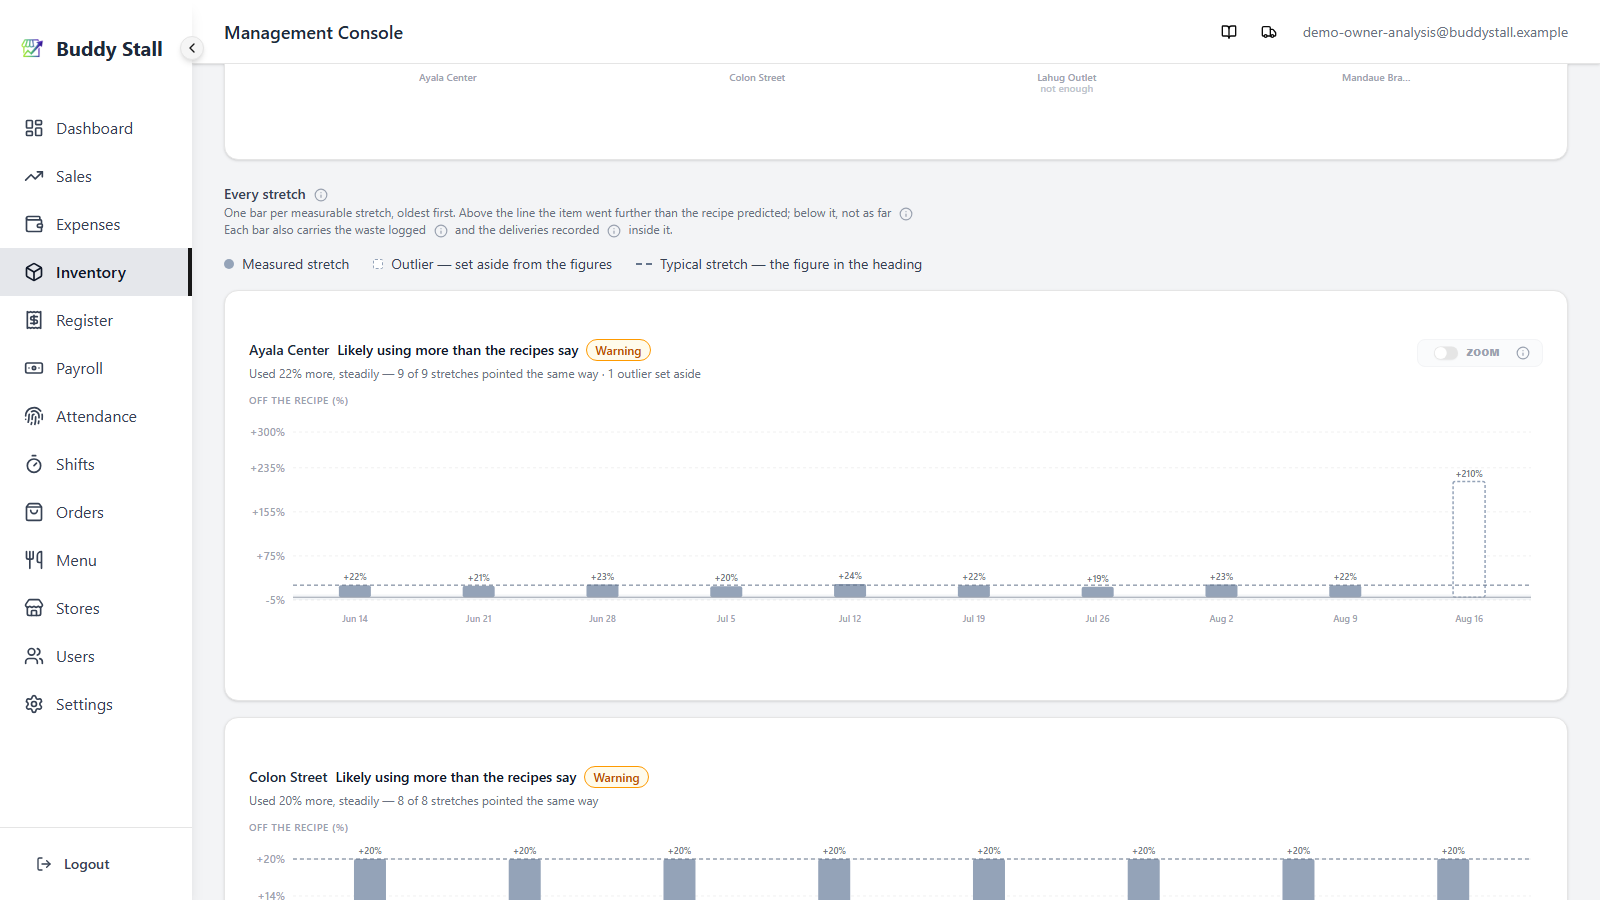
Below that, one chart per store, one bar per stretch, oldest first, each labelled with its own percentage.
 12345
123451 The legend — every mark these charts make that is not self-evident. Each entry appears only when that mark is actually on screen, so a legend never describes something absent.
2 The store's heading repeats the result, evidence and
badge in the same words as the ranking, so clicking through never tells a
second story. A store without a result is still charted — its stretches exist,
there are just too few — with a heading that reads 3 usable stretches · needs 5
and no typical line.
3 The typical stretch, drawn as a dashed line. The result claims a centre; this lets you check the scatter against that claim instead of taking it on trust.
4 An outlier — drawn hollow with a dashed outline. Counted, then set aside: excluded from the figures, never hidden from you.
5 Zoom appears on any store where one extreme stretch is flattening the rest. It rescales that store alone; the extreme bars then run past the edge rather than being dropped, and their values stay in the tooltip. Each store's axis is its own, so compare the numbers rather than the bar heights — cross-store comparison is what the chart above is for.
Hovering or tapping a bar gives the full stretch: its dates and length, how many counts it was built from, Recipe predicted, Actually used, the Gap in both units and percent, Waste logged, and Restocks.
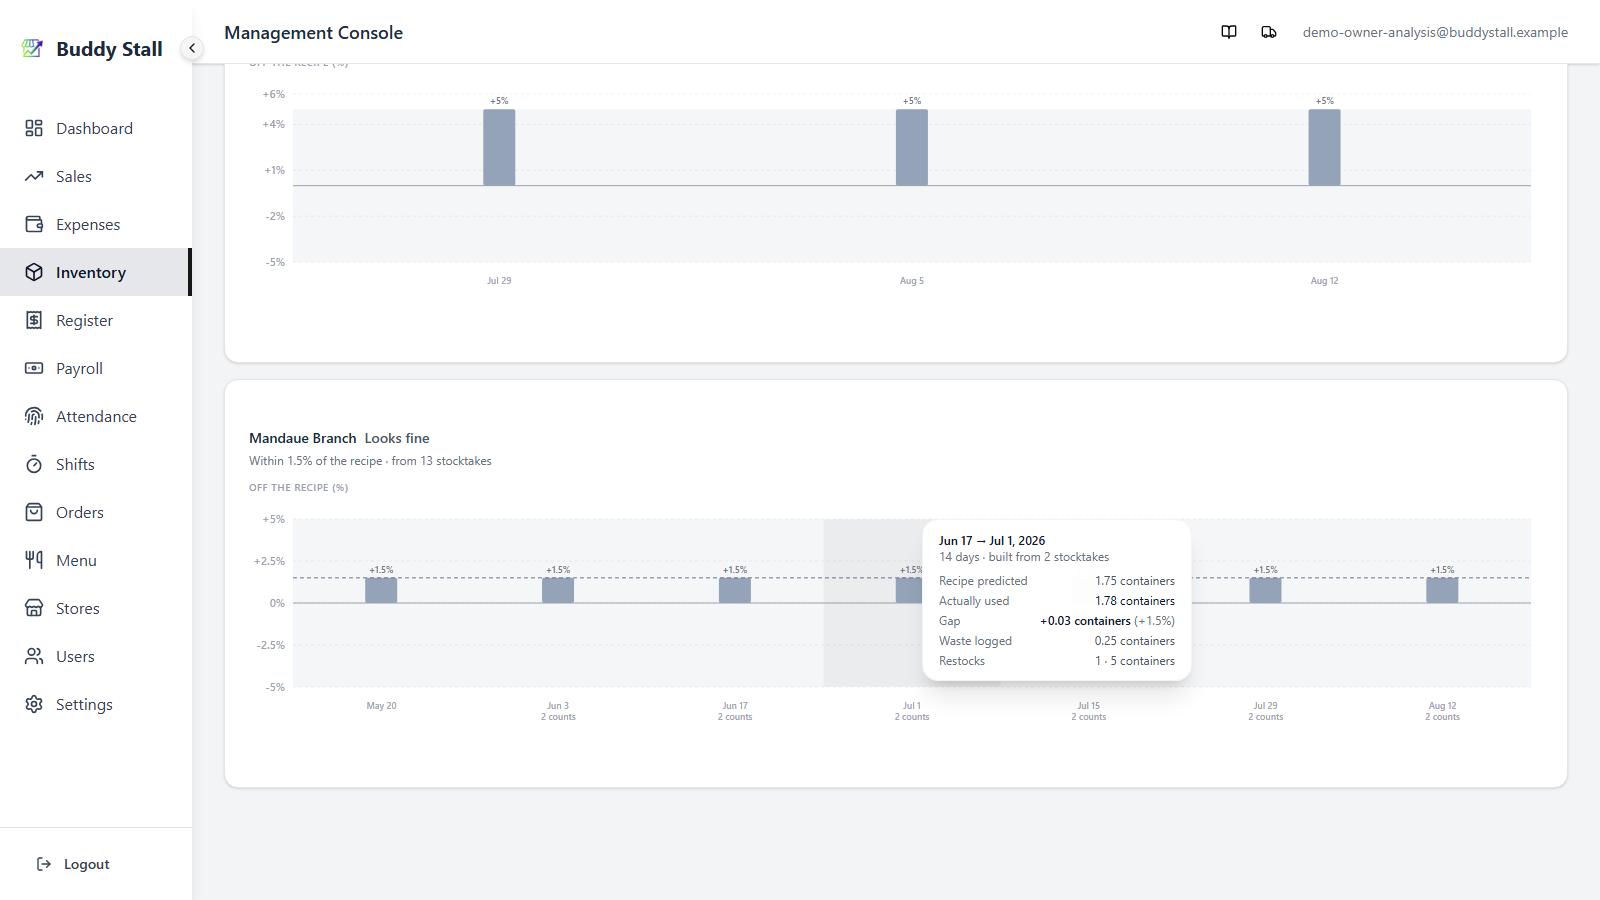
Waste you record is already deducted from expected stock, so it can never create a gap on its own. Do not subtract it from the gap — that double-counts.
It is shown for a different reason: it tells you whether this store logs waste at all. A stretch with a big gap and no waste logged, on something that spoils, is worth a look. A store that logs waste in most stretches makes "waste nobody wrote down" the less likely explanation.
Restocks is there as a suspect: a delivery entered with the wrong quantity moves expected stock without moving real stock, which produces exactly the same gap a wrong recipe amount does. The quantity is shown next to the count so you can see whether it is even the right size to explain the gap.